

Erosion Susceptibility Analysis#
RUSLE-based erosion susceptibility analysis using LS-factor, STI, SPI, profile curvature, and slope. Produces an Erosion Susceptibility Index (ESI) scaled 0-100 with 5-level classification.
Inputs:
Terrain Analysis Package (ZIP). ZIP file from Comprehensive Terrain Analysis containing DEM, slope, flow accumulation, curvature, STI, SPI, and manifest.json
Weight: LS-Factor. Weight for the LS-factor indicator (default: 0.35)
Weight: STI. Weight for the Sediment Transport Index (default: 0.25)
Weight: SPI. Weight for the Stream Power Index (default: 0.15)
Weight: Curvature. Weight for the profile curvature indicator (default: 0.10)
Weight: Slope. Weight for the slope indicator (default: 0.15)
Hotspot Threshold. ESI value above which areas are classified as hotspots (default: 65)
Spectral Indices Package (ZIP). Optional ZIP from spectral_indices with vegetation index aggregates. When provided, a vegetation indicator is added to the weighted overlay.
Weight: Vegetation Index. Weight for the vegetation index indicator (default: 0.10). Only used when spectral_zip is provided. Other weights are scaled down proportionally.
Outputs:
Erosion Analysis Package (ZIP). ZIP archive with erosion susceptibility rasters, vectors, statistics, and manifest
Summary. Human-readable summary of the erosion analysis results
Manifest JSON. JSON manifest string describing all outputs
Launch the tool: https://toolbox.nextgis.com/t/erosion_analysis
Example:
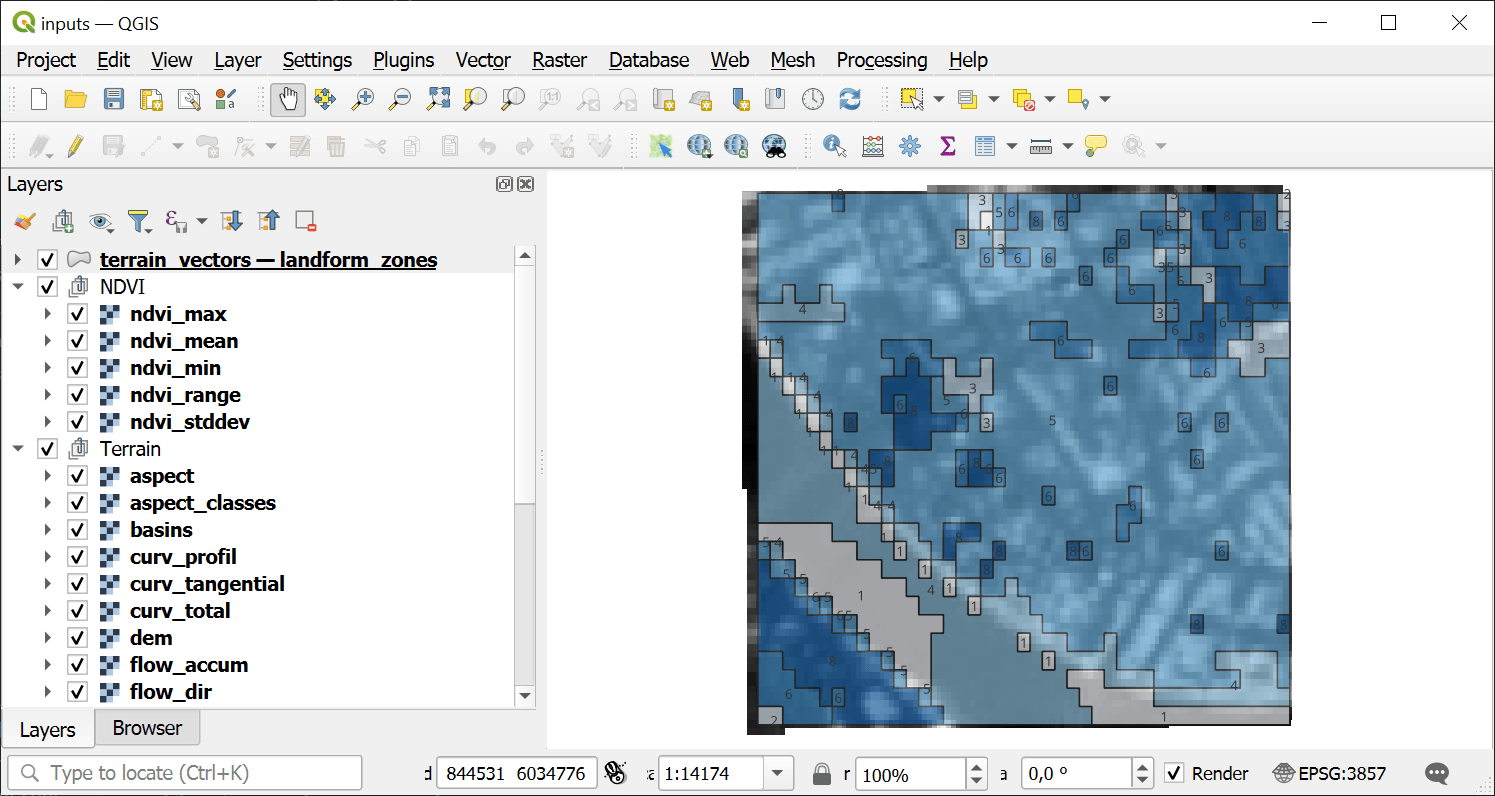
Fig. 147. Example input#
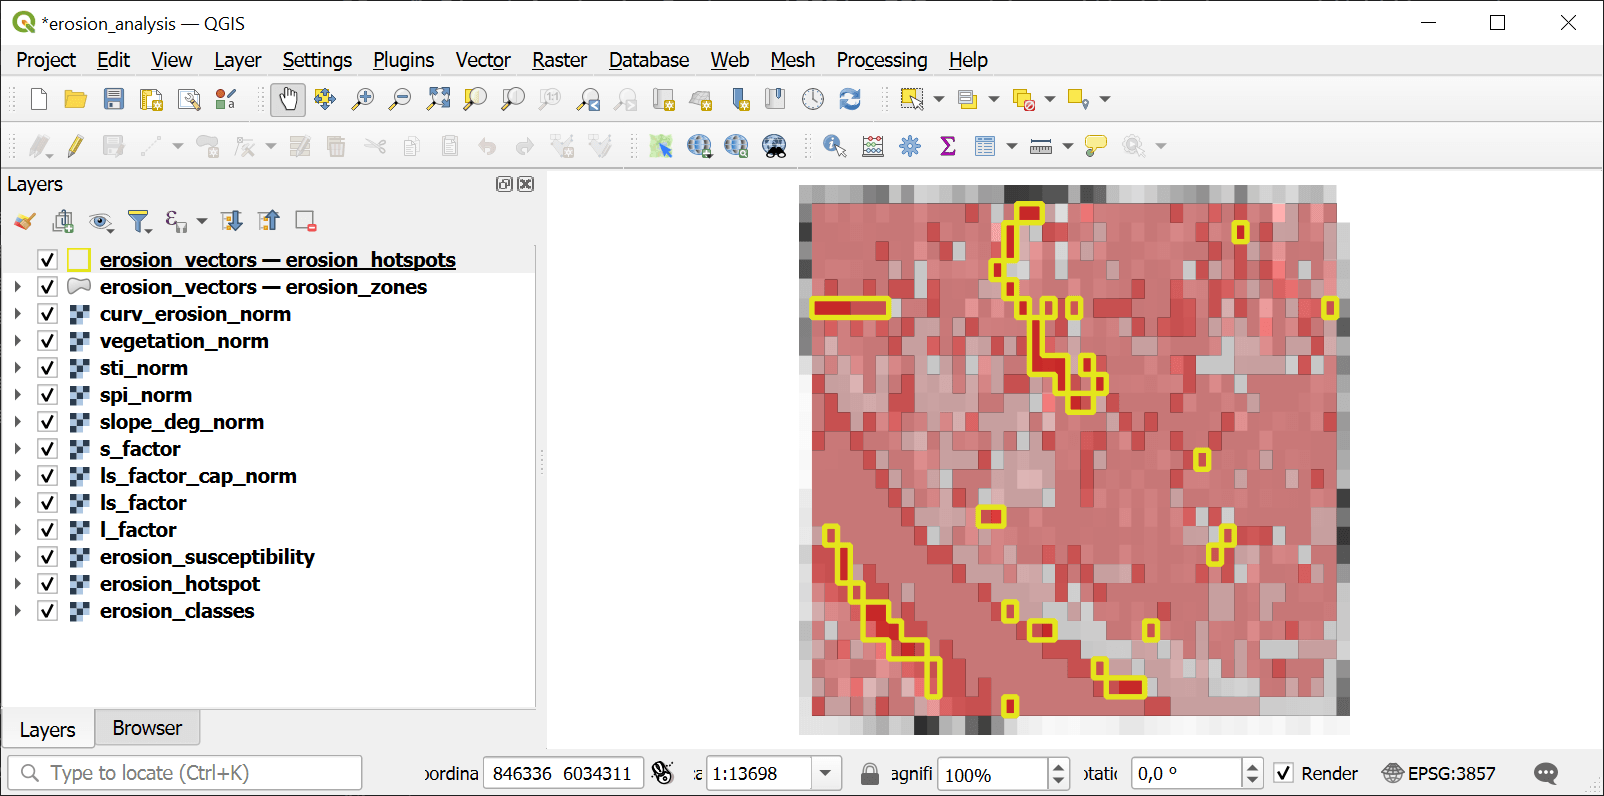
Fig. 148. Example output#
Try the tool in action
Click on the Demo button above the tool form. The fields are filled in with demo values.
Click on the Run button.