7.31. Trackers settings
In the Trackers section of the Control panel you can configure the display of the tracks on Web Maps and their export as GPX files.
Here are the parameters that can be modified:
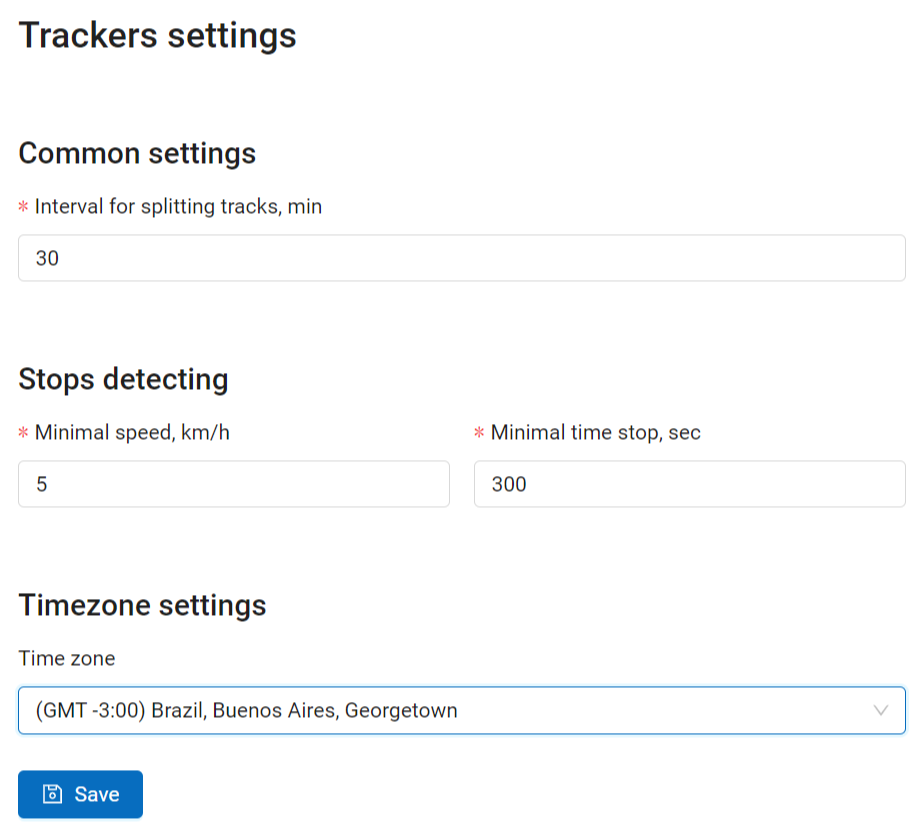
Pic. 7.334. Trackers settings
Interval for splitting tracks, min (default value is 30)
Parameters for detecting stops: if the speed is lower than a set amount for a set time, a stop is recorded in the track. Minimal speed is in km/h (the default value is 5). Minimal time to mark a stop, in seconds (the default value is 300 sec., i.e. 5 min.).
Timezone settings - select a time zone marked as GMT+-N from a dropdown menu
Note
The number of trackers available depends on your subscription plan. On Free and Mini you can add 1 tracker, on Premium the default limit is 5 trackers, but it can be extended.
7.31.1. Viewing tracks on a Web Map
Data on moving objects collected in NextGIS Tracker, NextGIS Collector or NextGIS Mobile can be displayed on any Web Map of your Web GIS if the tracker is linked to it.
To view the tracks open any Web Map or create a new one. On the left panel bar you’ll find the tracker icon ![]() .
.
Pic. 7.335. Opening Trackers panel
Tracker panel has two parts: calendar and tracker list.
Use the calendar to filter tracks by date and time.
Below you’ll see the list of all available trackers. Trackers can be sorted by name or time of the recording.
By default the tracks are hidden. To view a track on the Web Map, find the tracker(s) in the list and select track elements you’d like to display. Then set a date range in the calendar or in the track’s context menu select Set filter to last day with data.
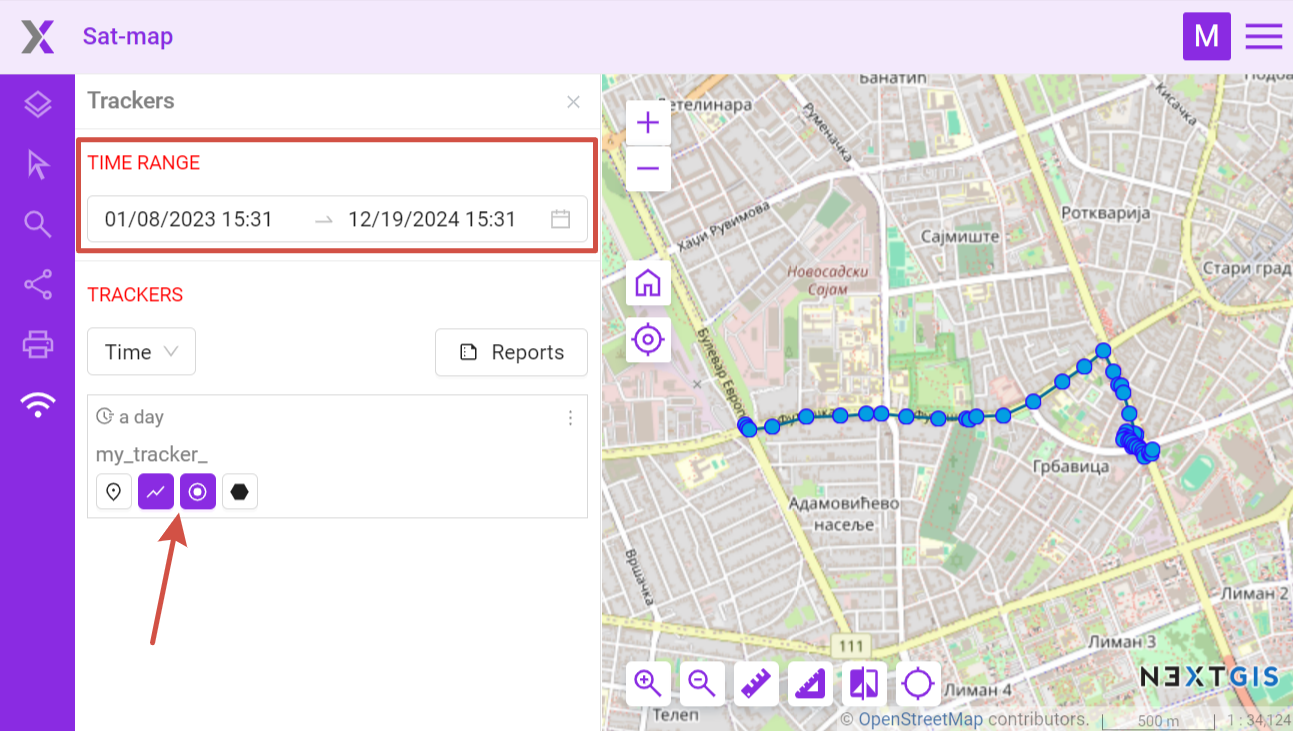
Pic. 7.336. Viewing track on Web Map
Elements you can view:
Three dots in the top right corner of the track open its context menu that allows to:
Zoom to layer;
Set filter to last day with data;
Show last activity (hourly chart for a selected date).
Pic. 7.337. Tracker menu
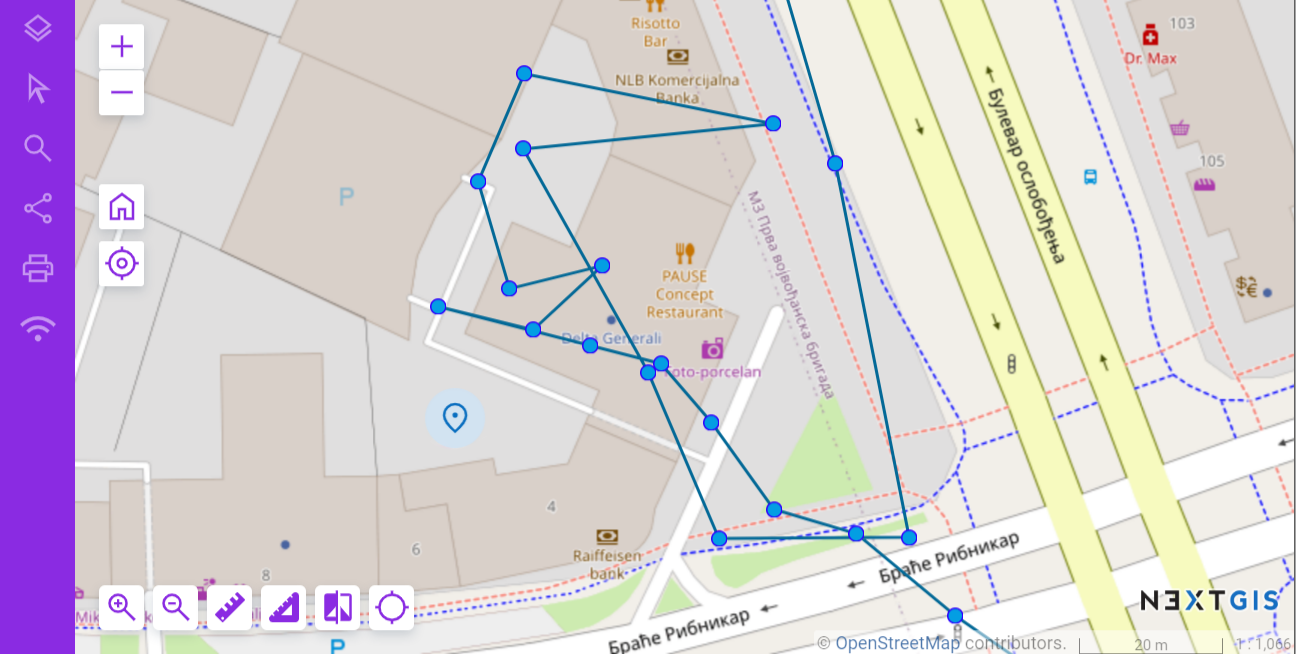
Pic. 7.338. Viewing a GPS track, track points and current location on a Web Map
Click on a point to show a popup with tracking information: date, time, speed (km/h), height (m), course (bearing i.e. the horizontal direction of travel of this device in the range between 0 and 360 counting clockwise from the North), number of satellites and HDOP.
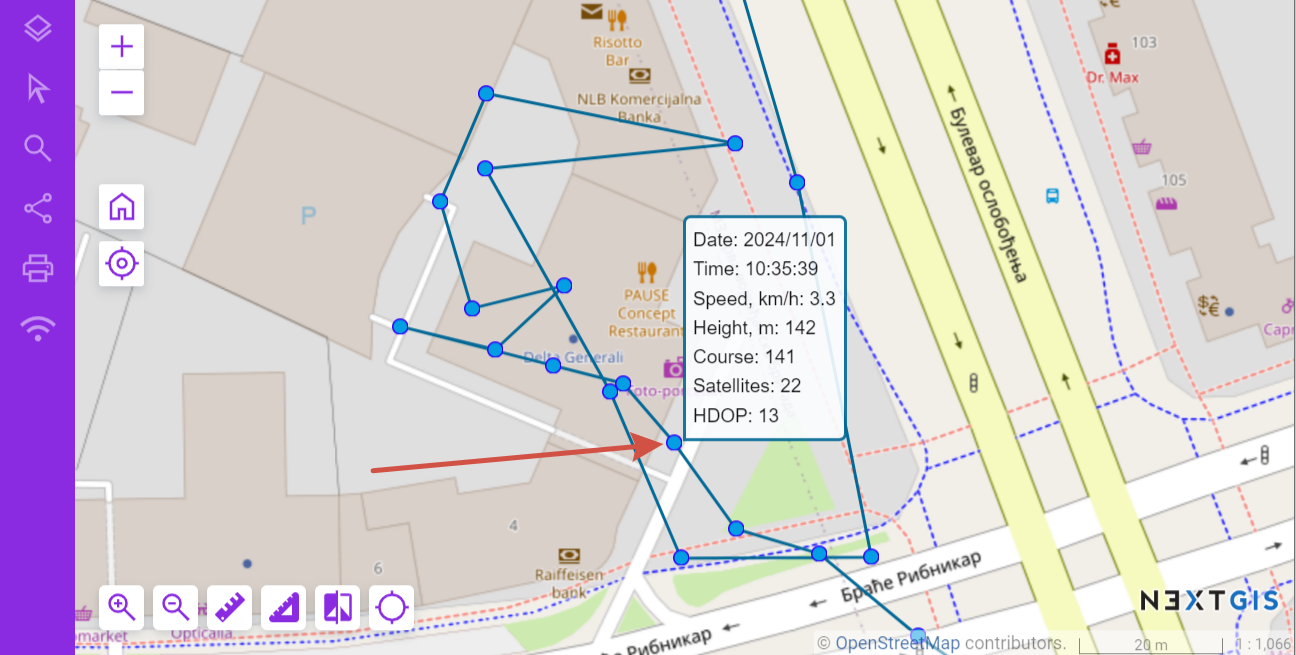
Pic. 7.339. Pop-up window with track point info
Horizontal dilution of precision or HDOP is a parameter showing how precise the GPS readings are. The smaller the HDOP value, the higher the accuracy of horizontal coordinates. HDOP=1 is ideal, 3-4 is okay, if HDOP is over 6-8 it means that the position of satellites at the moment is unfortunate providing information with low accuracy. HDOP depends on the number of visible satellites, their position in the sky and relative to the receiver.
7.31.2. Reports
By clicking the ‘Reports’ button you can create various types of reports depending on selected tracker and parameters.
Pic. 7.340. Button opening the reports page
A separate page for creating tracking reports opens.
Pic. 7.341. Report settings
In the first block, you need to select the trackers for which you want to get an information summary.
report type (mileage, top speed, average speed, spent fuel, stops, GPX-file);
time range;
grouping by days/hours.
Next select the trackers that you want to get information about and press The report will appear on the same page below.
Pic. 7.342. Tracker report
Note
For getting the spent fuel report you need to set up fuel consumption parameter in NextGIS Web settings (l/100 km)
7.31.3. Export to GPX
You can use the report page to export track with the selected parameters as a GPX file.
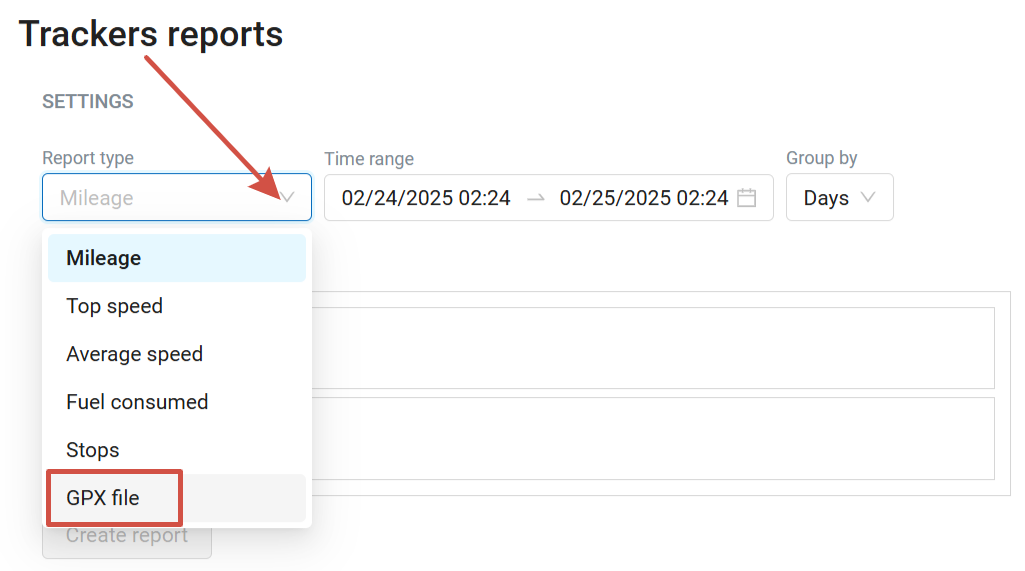
Pic. 7.343. Export as GPX