Web Map viewer#
A special web application for viewing Web Maps is included in NextGIS Web (see Fig. 514.).
To view the Web Map press  next to its name in the resource list or open the resource page and select Display in the Actions panel on the right. The following page will open:
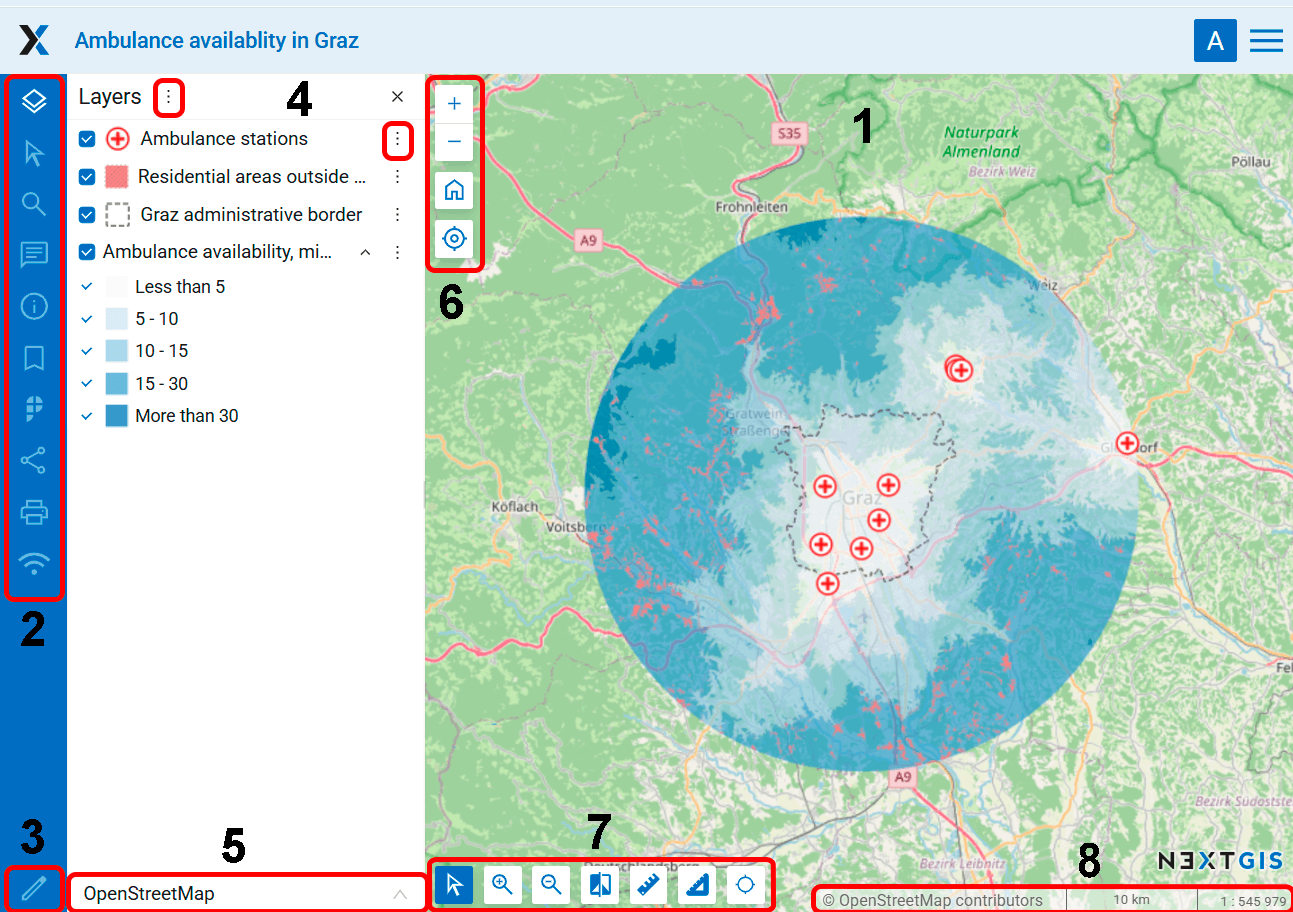
Fig. 514. The interface of viewer client application#
Numbers indicate:
1 – map;
2 – map panels;
3 - open Web Map settings;
4 - layer tree with layer menu buttons;
6 and 7 - map tools;
8 - status bar and copyright.
Zoom and rotation#
The status bar (see Fig. 514.) displays the current scale of the map. If you use the identify tool to click on the map, a pop-up window will show the coordinates of the point you clicked on and list map features if present in this point of the map.
You can change the scale of the map using zoom tools (see item 5 in Fig. 514.). To reset the map to its initial extent, press the house icon.
There are some options to work with map:
if you click on
alt + shiftsimultaneously and execute round cursor movements around a monitor, a map will turn for a certain degrees to the right or to the left,if you simultaneously click on
shiftand select of the necessary part of a map on a monitor by a cursor, you will highlight this part and zoom in it on the map.
To view your current location on the map, press  . See how it works in our video:
Watch on youtube.
Panels#
On the left side of the workspace are the functional panels:
 Share here you can generate a link to the Web Map or an embed code


Map tools#
Tools to work with the Web Map (see Fig. 514. item 6) named from left to the right:
Top left:
 zoom;
zoom; back to initial extent;
- show my location.
Bottom left:


See detailed descriptions below.
Measuring tools#
Map tools allow to measure distance (straight or segmented line) and area. Activate the tool and draw a line by clicking on the map. Double-click to finish line creation. You can draw multiple measuring lines on a map and compare results. To delete one of the measurement lines, press X on the measurement results lable. To clear selection, press the tool button again.
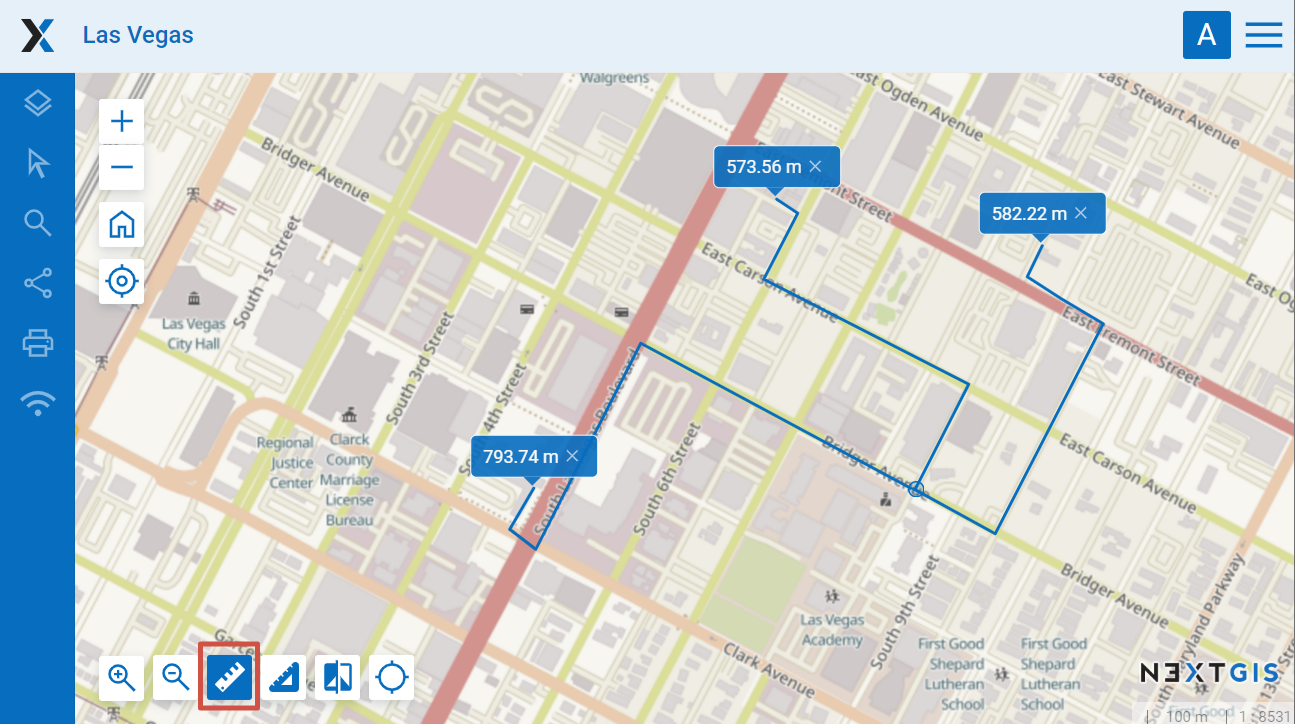
Fig. 515. Measuring distance on the Web Map#
To measure area draw a custom polygon on the map. Double-click to finish the polygon.
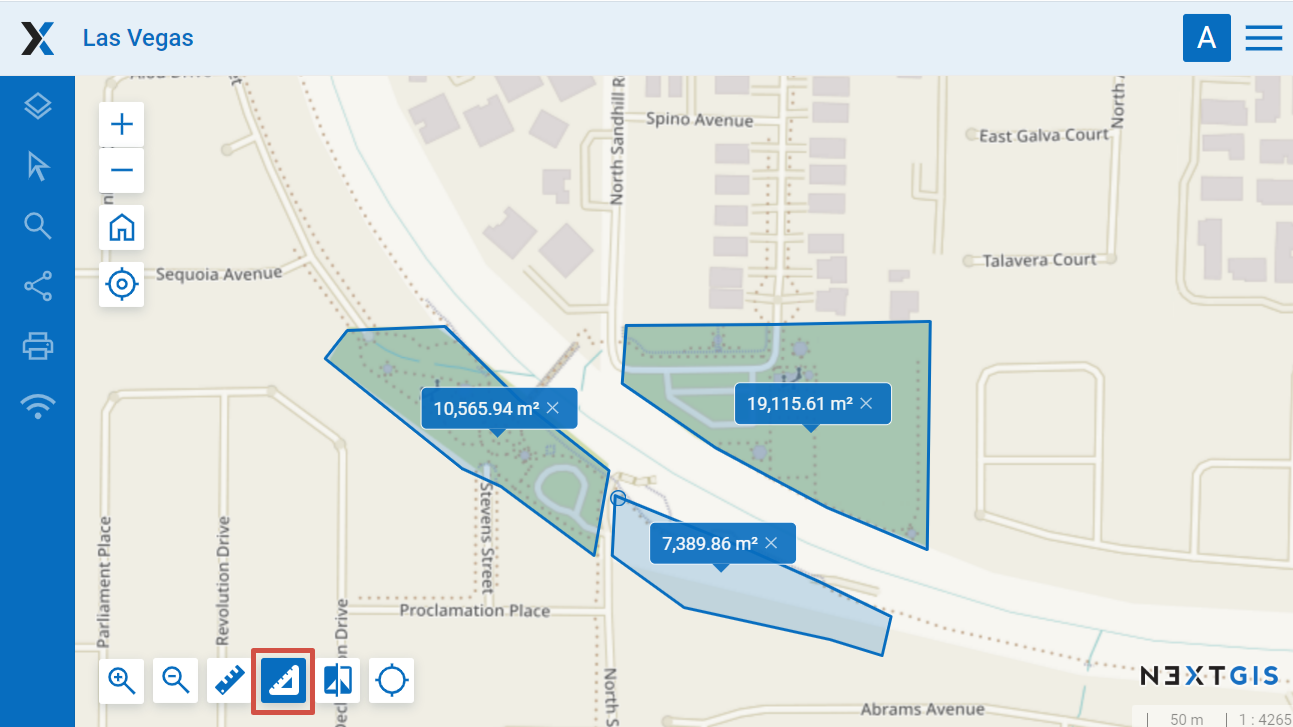
Fig. 516. Measuring areas on the Web Map#
Measurement units are selected in the Control panel
Swipe#
Swipe makes the selected layer transparent to one side of the line.
To select a layer click on it in the layer tree (it will be highlighted in blue), then press the swipe button  (see Fig. 517.).
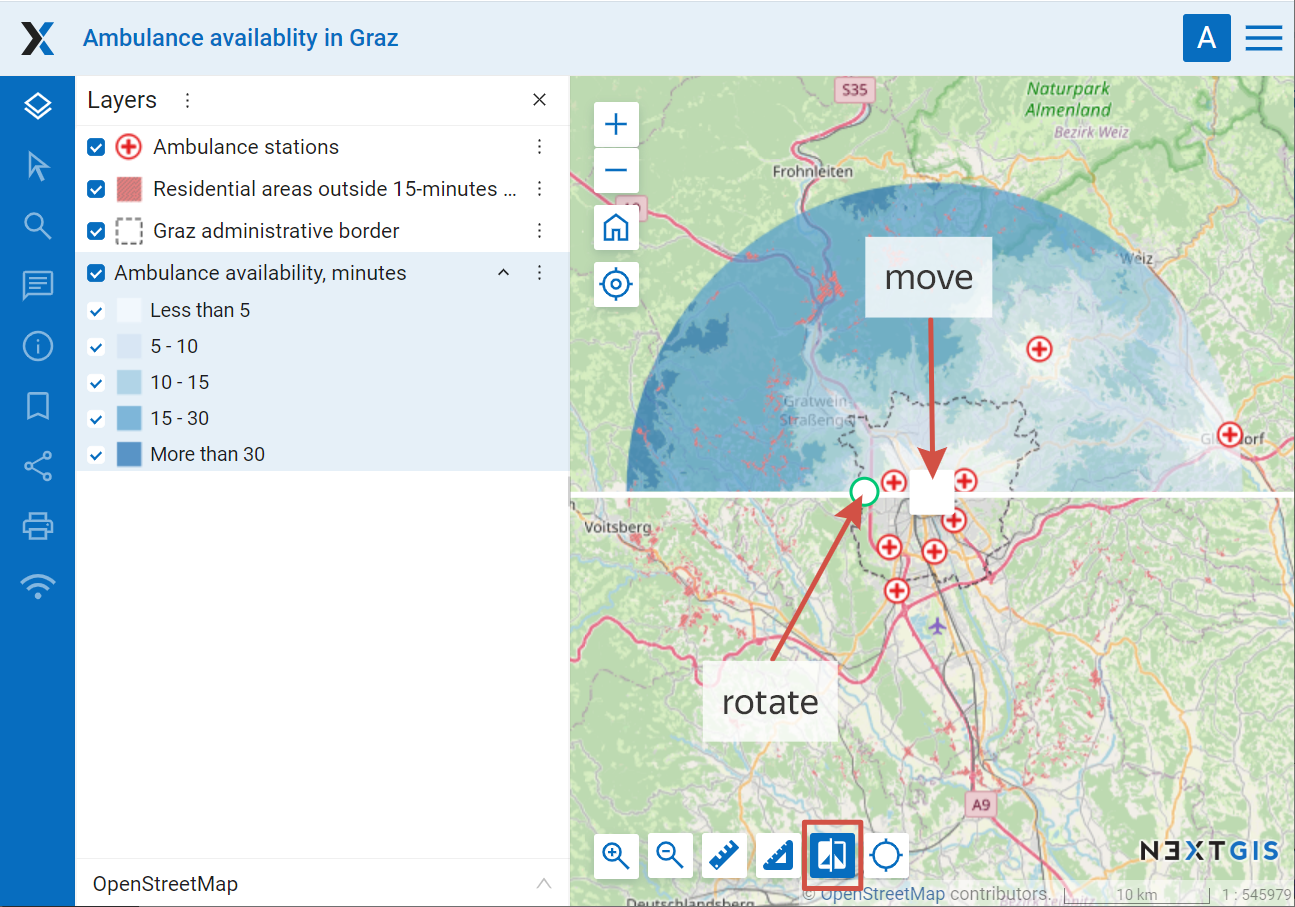
Fig. 517. Horizontal swipe. Selected layer is marked in blue#
Use the square in the center to move the swipe and the circle on the line to rotate it 90 degrees.
Swipe makes it possible to “peek” under the selected layer and compare it with the substrate or another layer on the map. The tool will be useful if we want to compare changes in the terrain by satellite images for different dates (for example, to identify forest felling or floods).
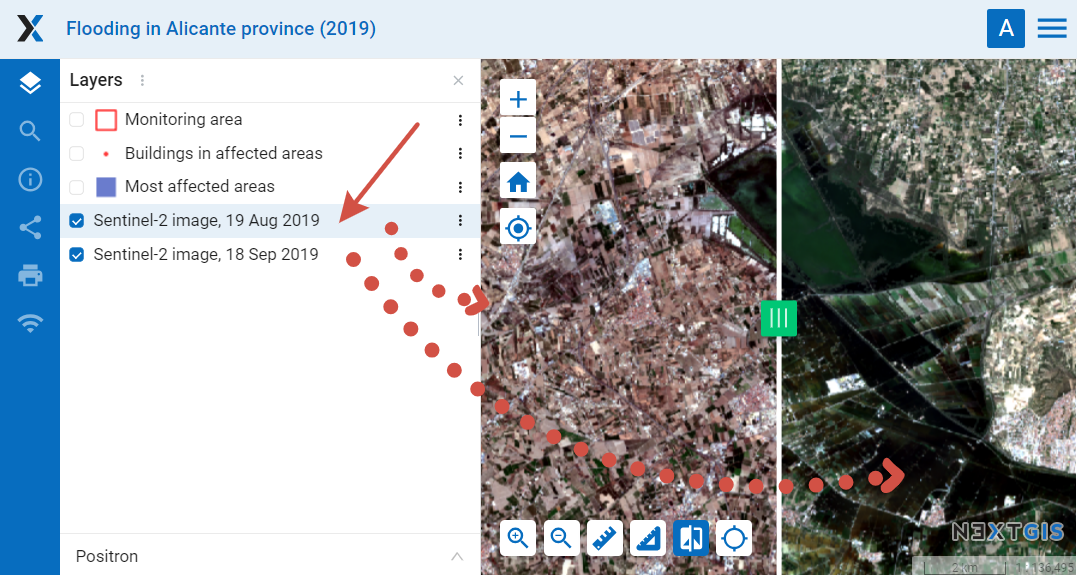
Fig. 518. Satellite image after applying the vertical swipe#
Show extent or cursor coordinates#
A field can be added to the Web Map interface to show the coordinates of the current cursor position or the extent of the visible map area. To activate it, press the  button in the map tools panel.
The icon on the right indicates what is displayed. Click on it to switch between modes.
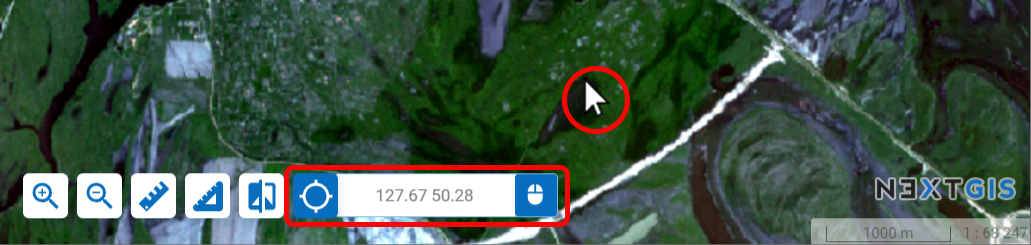
Fig. 519. Cursor coordinates mode#
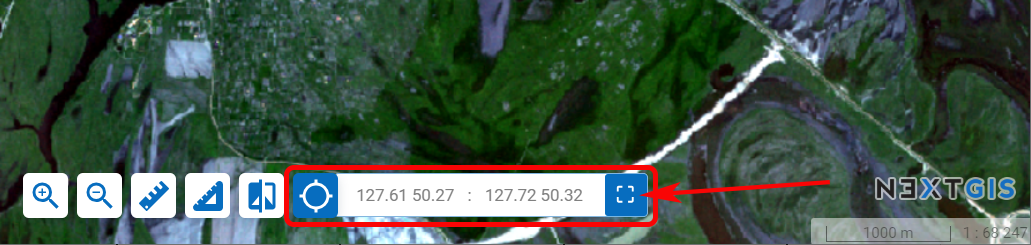
Fig. 520. Extent mode#
Share#
In the “Share” panel you can:
copy a link to the Web Map (the link includes zoom level and layer visibility);
add the visible fragment of the Web Map to favorites;
configure and copy the code for embedding the Web Map to a Web site.
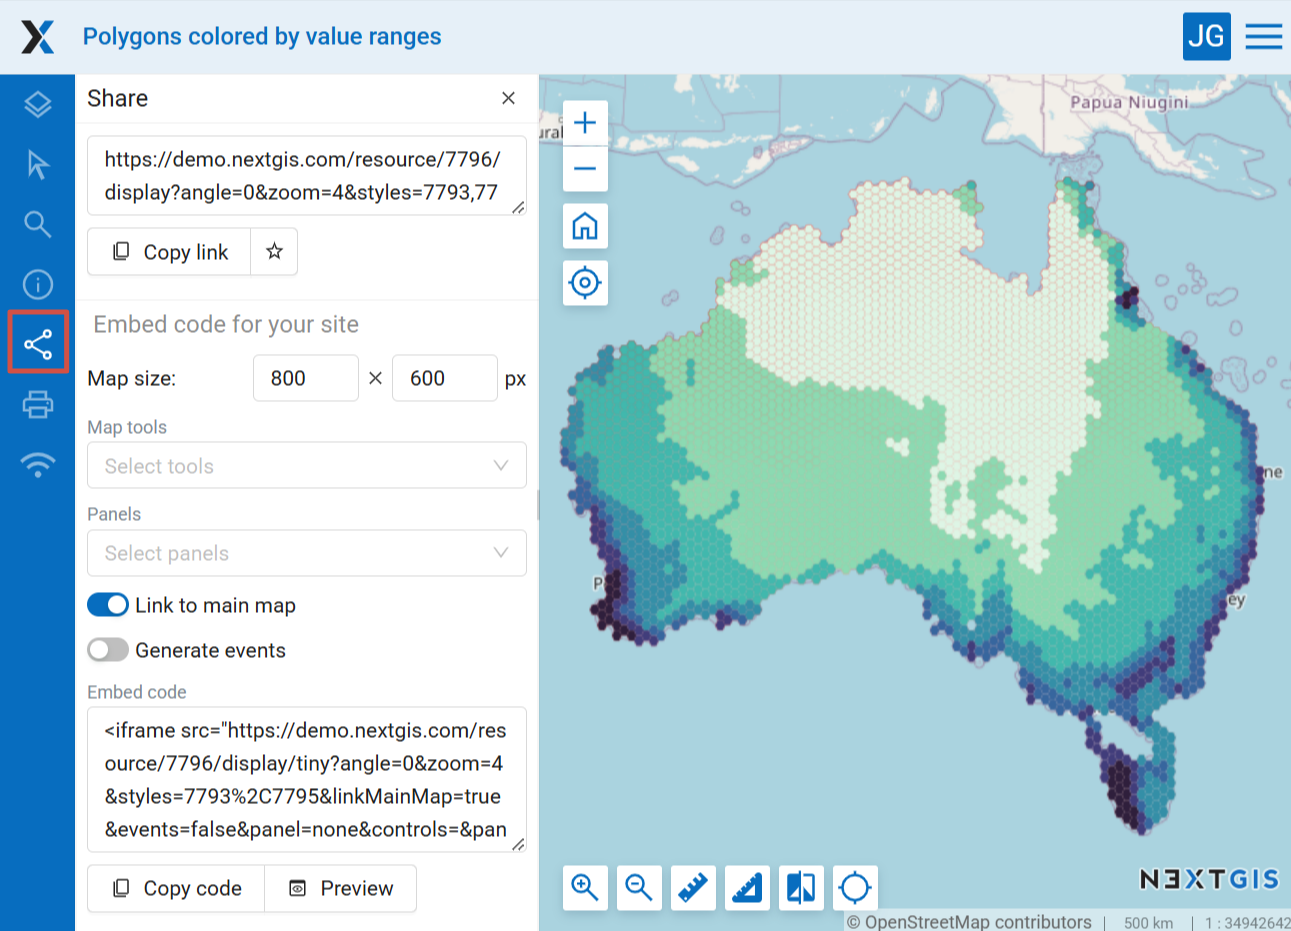
Fig. 521. “Share” panel#
Link to a Web Map feature#
The easiest way is to zoom in on the area and copy the link via the Share panel (Fig. 514.)
Using specially generated GET queries you can share a link to a particular feature of a layer. The link will open with the geographical context that you can select in the Web Map settings.
All you need to do is create links in the information systems. By clicking on them users will be directed to the map with the selected feature and context.
Such links can be automatically generated by your system integrated with NextGIS Web.
Example:
You can make such a link manually. Here’s what you need:
Link to the Web Map: https://demo.nextgis.com/resource/6118/display?panel=layers
For the feature:
hl_lid - layer ID (open the layer resource page and see the number in the URL, for example https://demo.nextgis.com/resource/6114, here
hl_lid=6114hl_attr – the name of the ID attribute field, for example
OSM_ID;hl_val – the value of the ID field.
You can also add:
zoom - value in numbers with 1 being the minimum.
Here’s the resulting link:
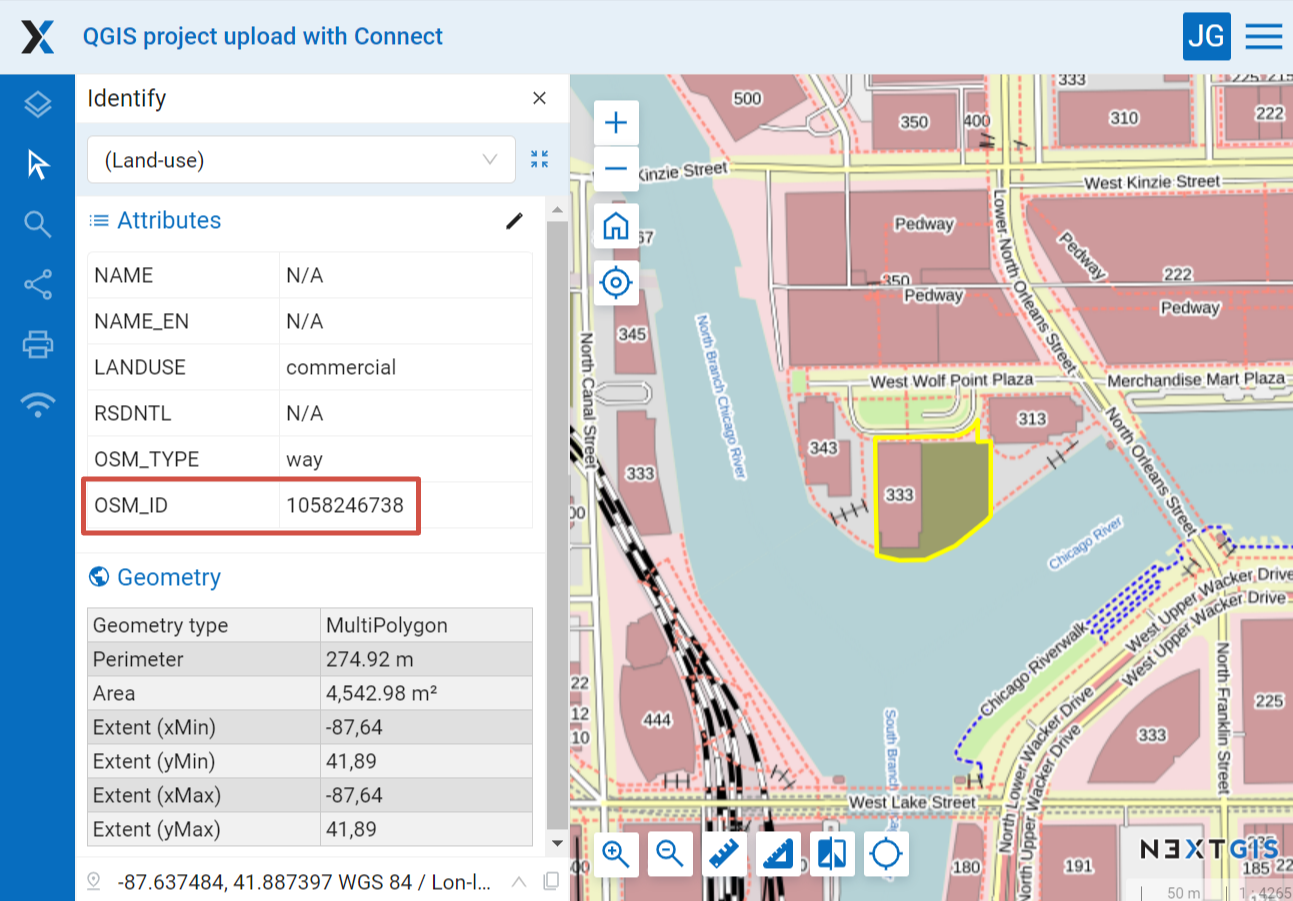
Fig. 522. Web Map opened via the link. The link contains the ID of the layer and the ID field name and value for the selected feature#
Legend in the layers tree#
The Layer tree panel  contains a list of all layer styles added to the Web Map.
The panel allows to:
Disable/Enable layer visibility by ticking the checkbox on the left. You can also hide parts of a layer by selecting items in the Web Map lengend. It’s helpful for big projects where one layer may contain a variety of features grouped by value of an attribute.
Change the order of the layers by dragging them within the layer tree. Refresh the page to restore the original order.
Click on the three dots next to the panel title to open the menu. In this menu you can:
 Zoom to all layers;
 Hide all layers;
 Reset layers to the initial visibility setting without reloading the page,
 Add layers.
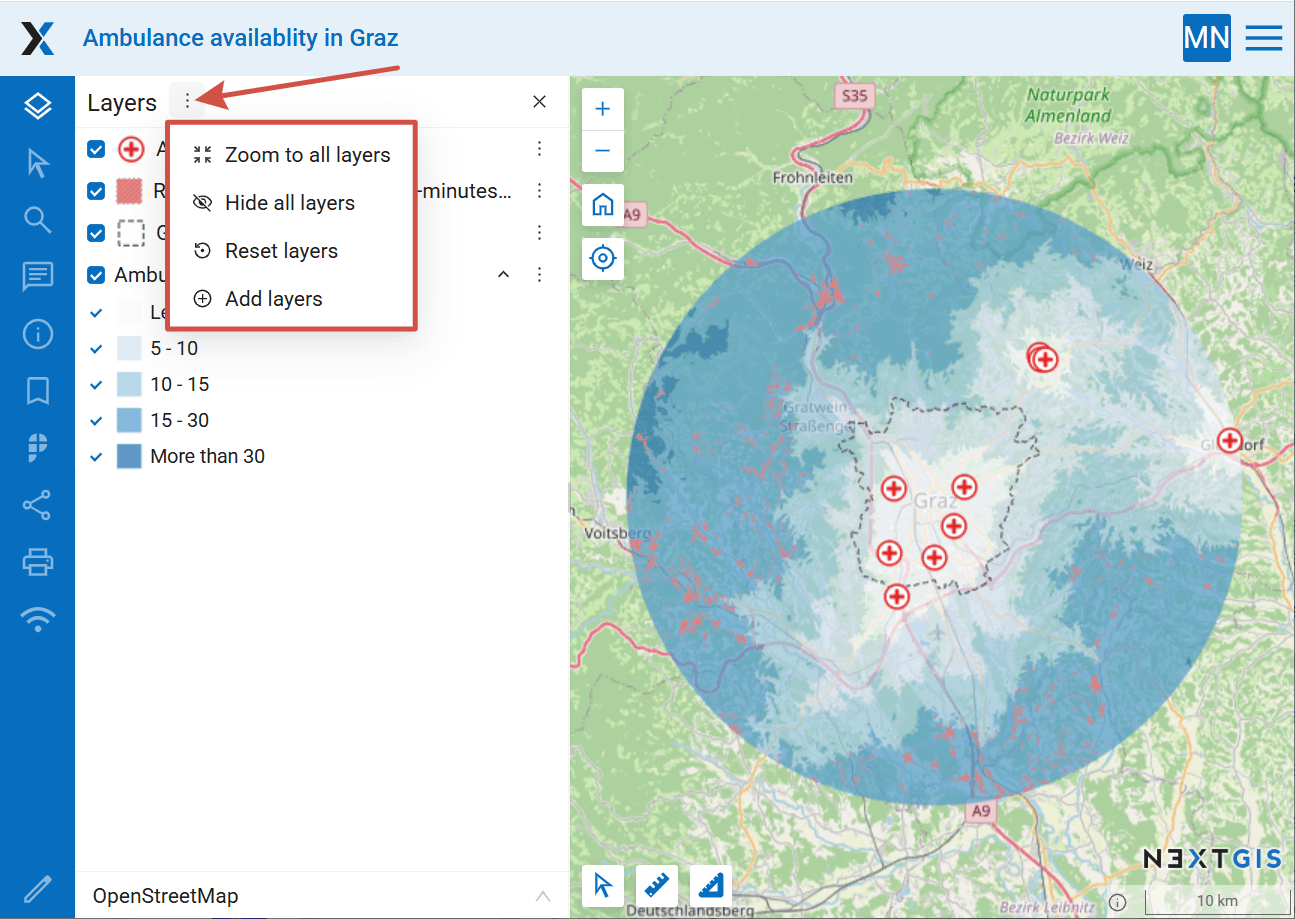
Fig. 523. Layer panel menu#
If you want the current state of the map legend to be the default for this Web Map, click  in the bottom left corner.
More on how to configure the legend.
Functionality of the layer panel is presented in our video:
Watch on youtube.
Layer menu#
Click on the three dots to the right of the layer name to open its menu. The following options are available:
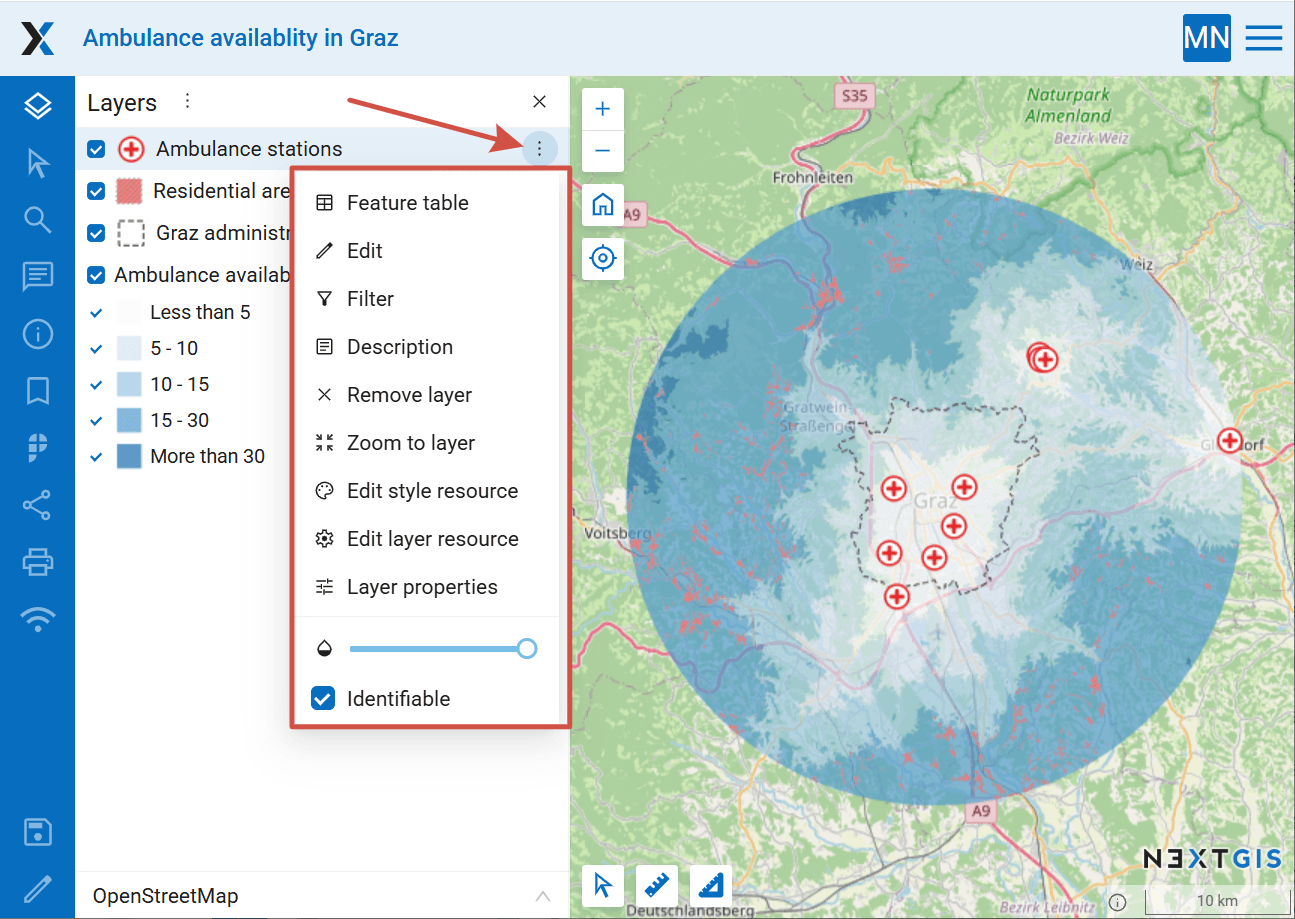
Fig. 524. Layer menu on the Web Map#
 To change the transparency of the layer use the slider.
 Feature table - opens the layer’s feature table on the map.
 Edit - activates the ability to to modify the features of the selected layer. To complete the process, open the dropdown menu again and select Stop editing (read more here) or click
  on the map.
 Filter - display only the features fitting set conditions.
 Description - view the description of the selected layer, if it has one.
 Remove layer from the legend (to reset it, click Reset layers in the panel menu).
- Zoom to layer - sets the map extent so that all features of the select area are in it.
 Edit style resource, opens in a pop-up window, more on style settings.
 Open layer resource, opens in a pop-up window, more on vector layer settings.
 Layer properties on this particular Web Map (more about layes on a Web Map).
When the Identifiable flag is on, a click on the map opens the Identify panel with the information about the layer feature. Untick it to have the layer ignored by the identification.
See how it works in our video:
Watch on youtube.
Filter#
For any vector layer you can add a filter. Select Filter in the layer menu. In the pop-up window add one or several conditions. If you add multiple conditions, you can select if all of them must be satisfied at once or any one of them is sufficient.
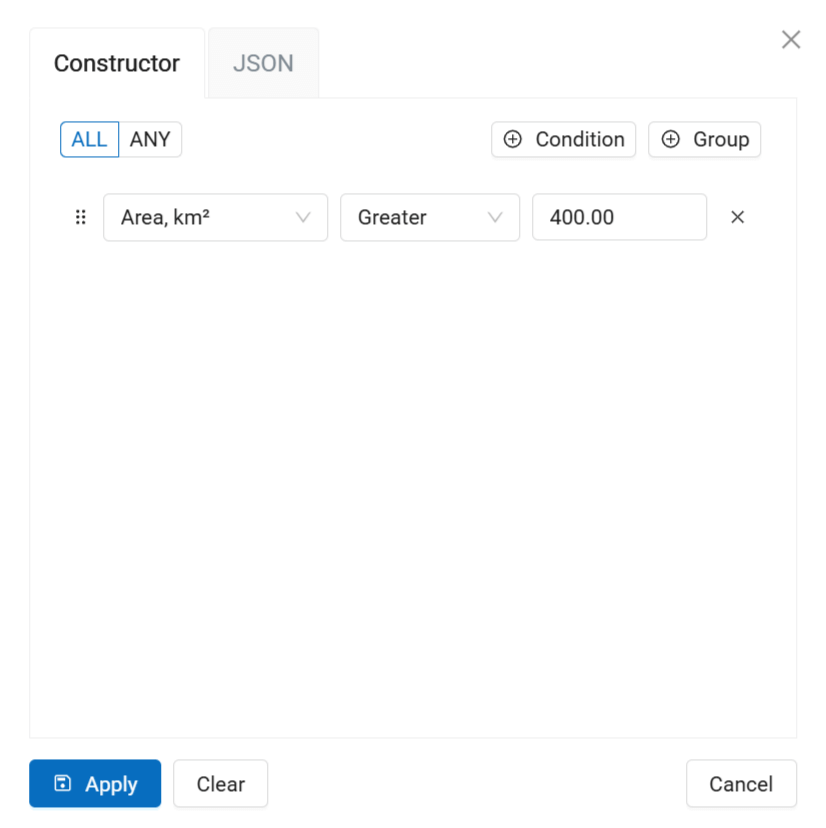
Fig. 525. Filter condition#
Click Apply. Only the features that answer the conditions are still displayed on the Web Map and in the Feature table.
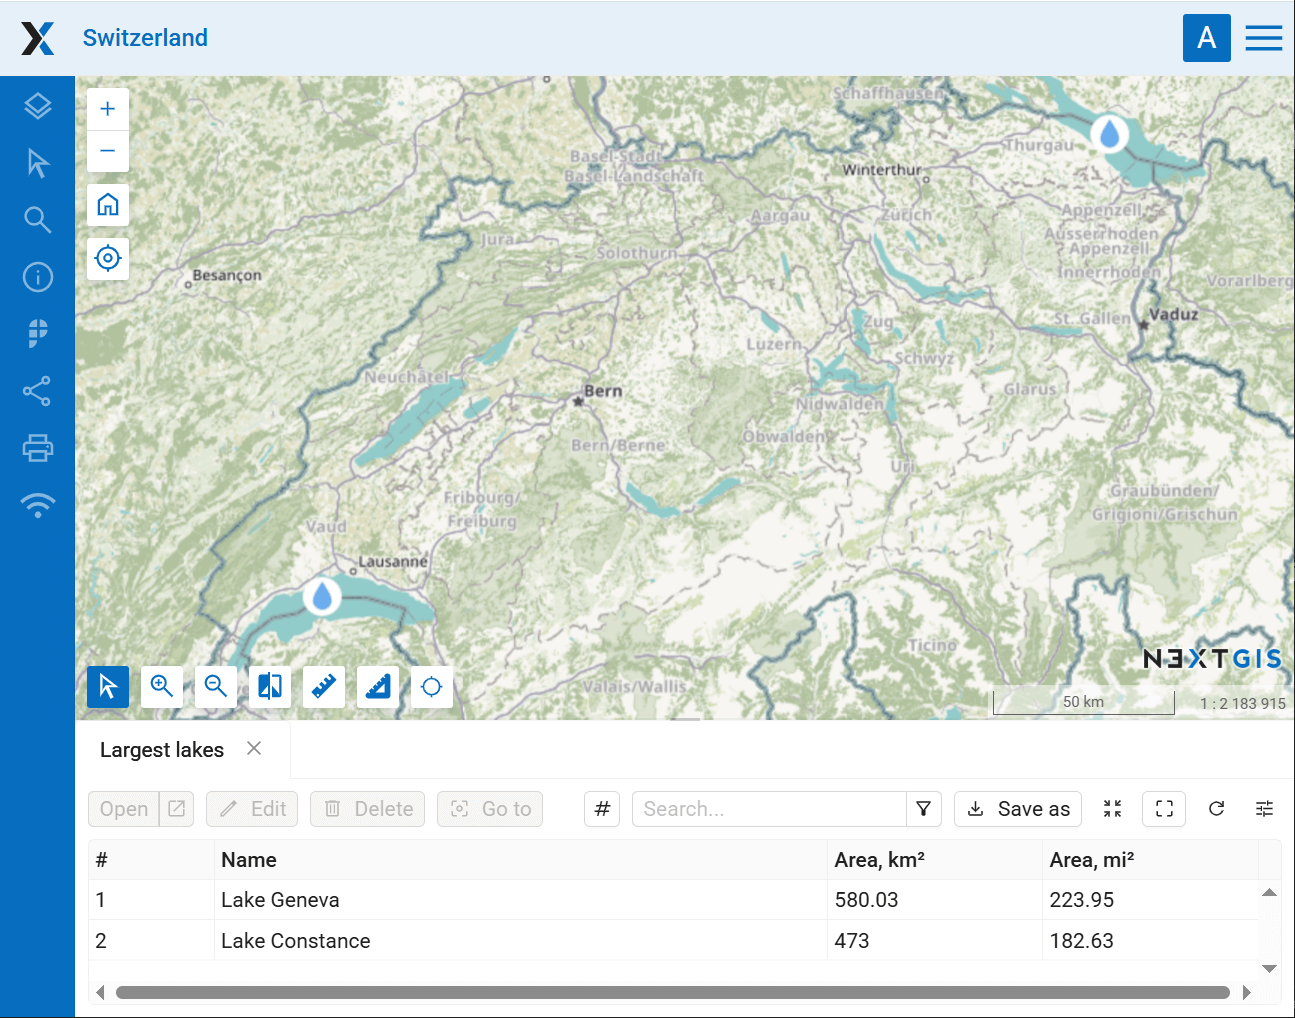
Fig. 526. Filtered features: lakes larger than 400 square kilometers#
You can also filter the features within a selected area.
Feature identification#
To get information about features on the Web Map activate the  identify panel. Click anywhere on the map to get info on vector features and raster pixels.
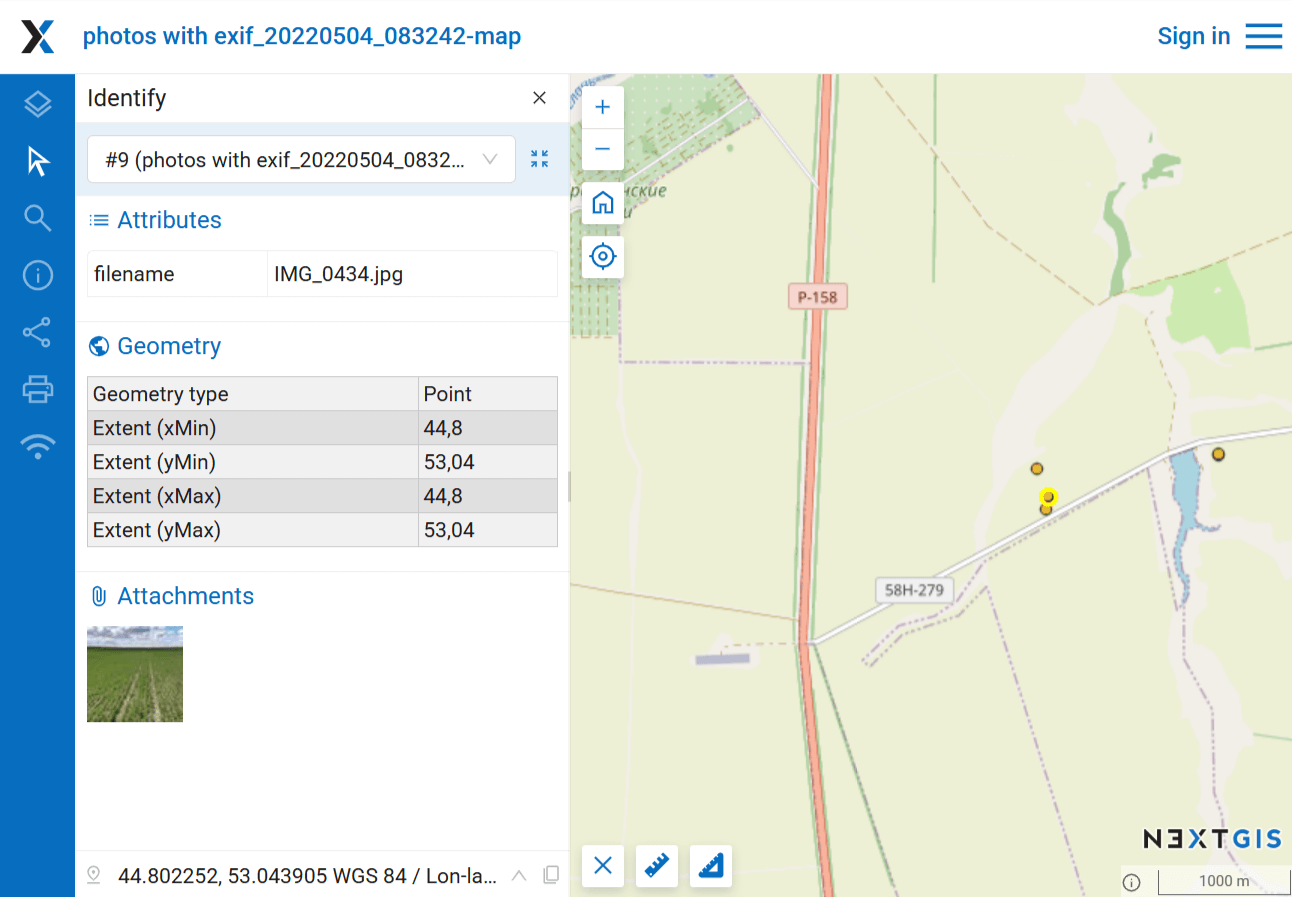
Fig. 527. Identify panel with feature information#
If a raster layer has raster attribute table, classes from it are displayed alongside the numerical value of the pixel.
Note
To use this feature, create raster layer via Web interface. Combine the .TIF and the corresponding .XML file into a ZIP-arhive. Then select this archive while creating a raster layer.
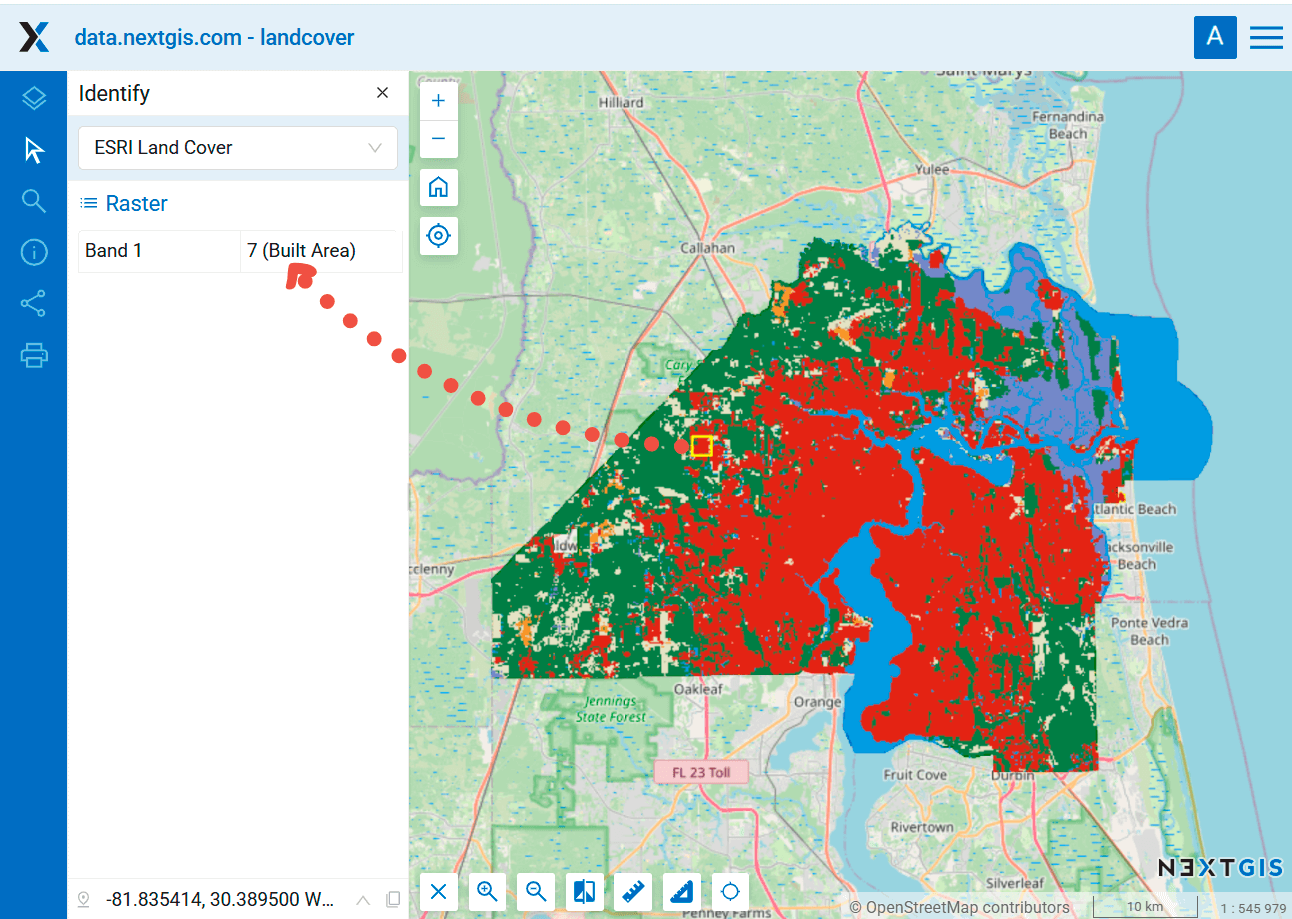
Fig. 528. Displaying a class from RAT#
If there are multiple features (for example a point and a line going through it), the identify panel will show the feature of the topmost layer. To view information on the other features click on the downward arrow to the right of the feature name and select the feature from the dropdown list.
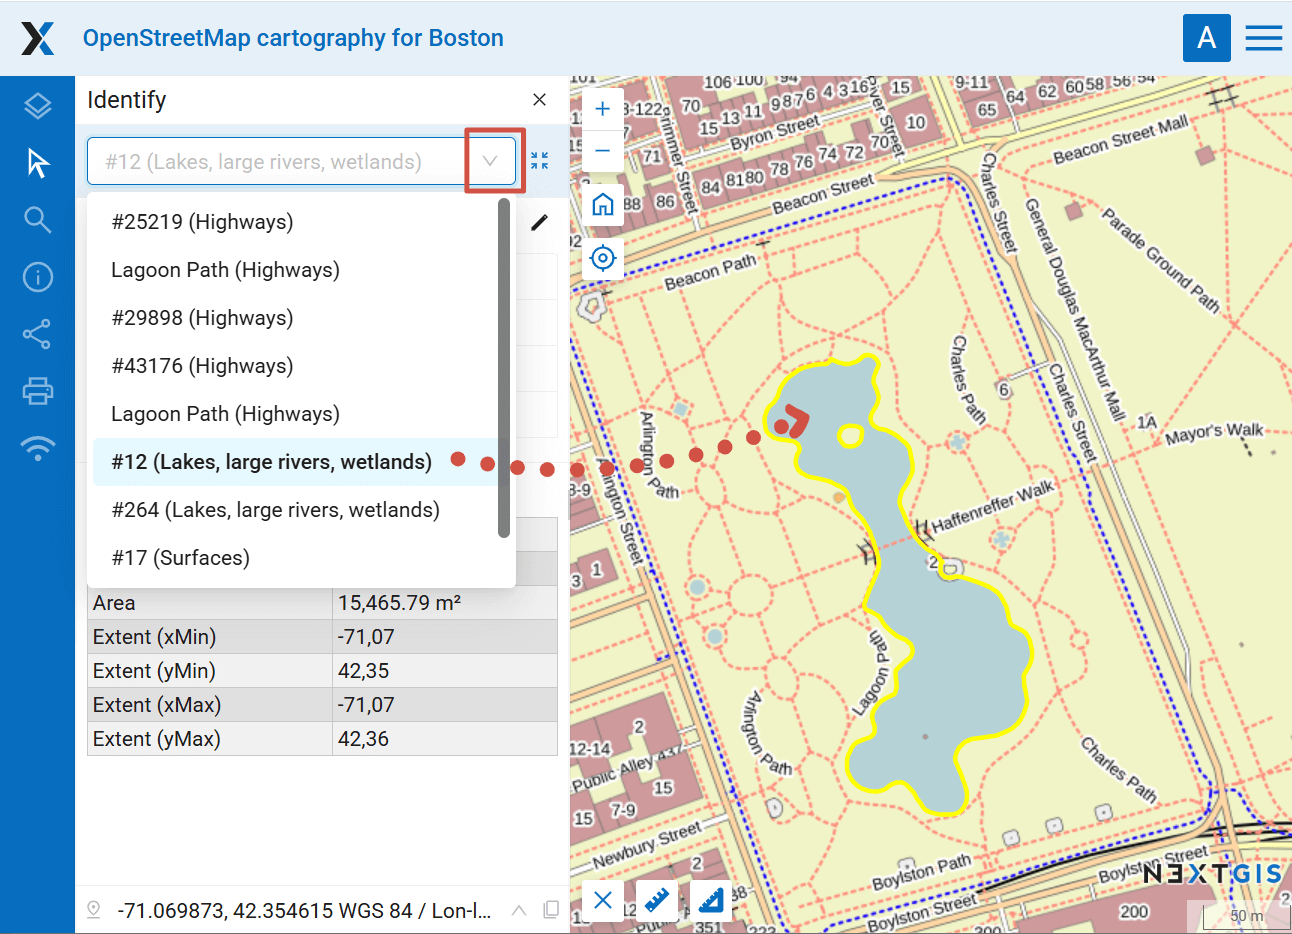
Fig. 529. Selecting feature in the identification panel#
To clear selection, click on ![]() in the bottom left corner. When no feature is selected, this button looks like this: .
in the bottom left corner. When no feature is selected, this button looks like this: .
To configure how far from the clicks the features can be to be identified and what parameters are displayed in the panel go to the Control panel.
You can turn off identification for a particular layer in the layer menu. Also, you can disable identification for individual layers and modify their order in the Web Map settings.
To modify attribute values of the feature, click on the pencil icon in the top right corner of the panel (more details).
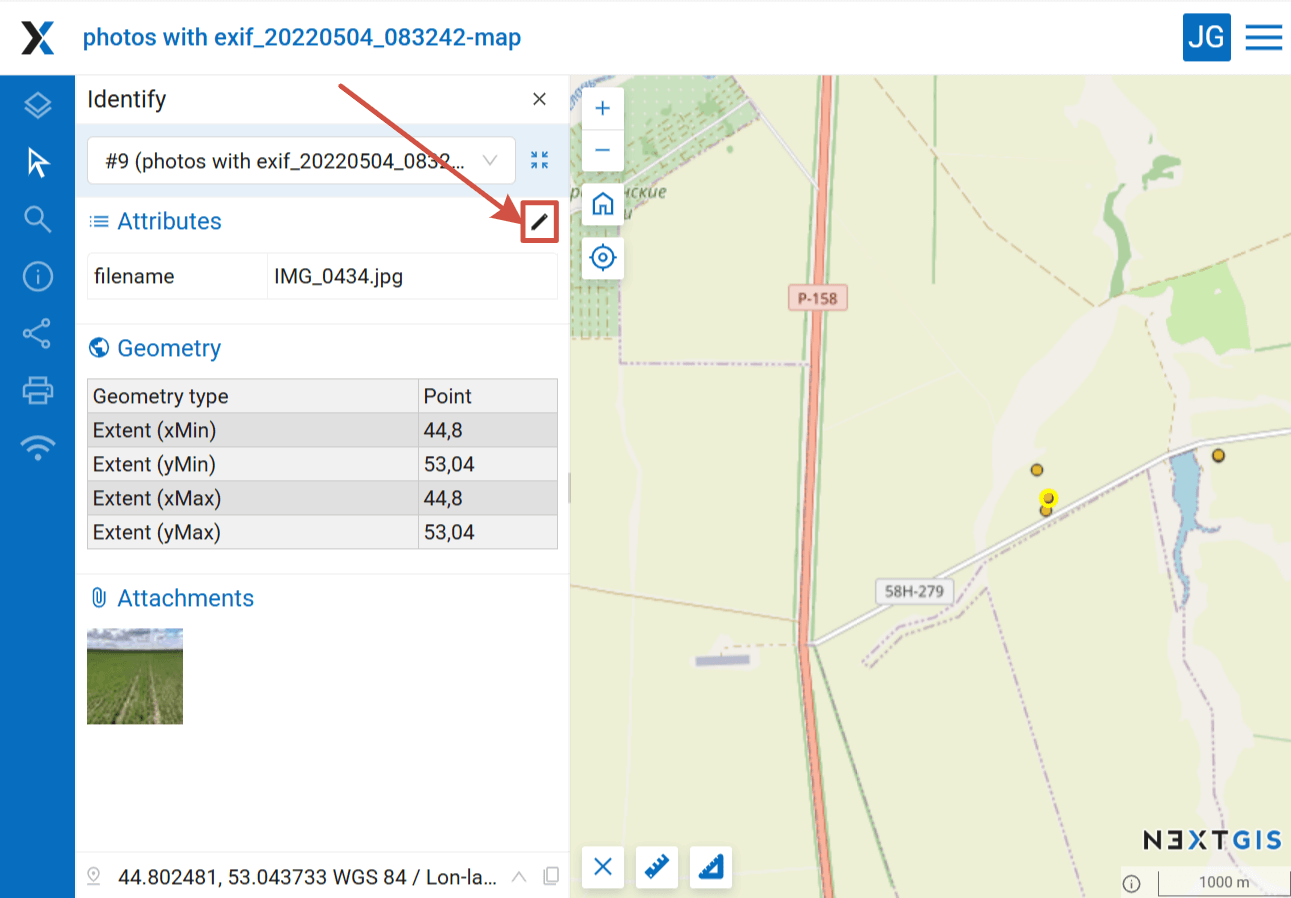
Fig. 530. Opening attribute editing window from the panel#
Search#
Search is performed using three sources:
Coordinates.
Attributes of layers added to a map.
Address database (OpenStreetMap or Yandex.Maps, depending on address search settings).
Results are shown as user inputs text and are sorted in this order: points on the map matching the coordinates, then feature numbers for attribute search and finally full addresses. After a click on a search result map changes extent to show selected feature.
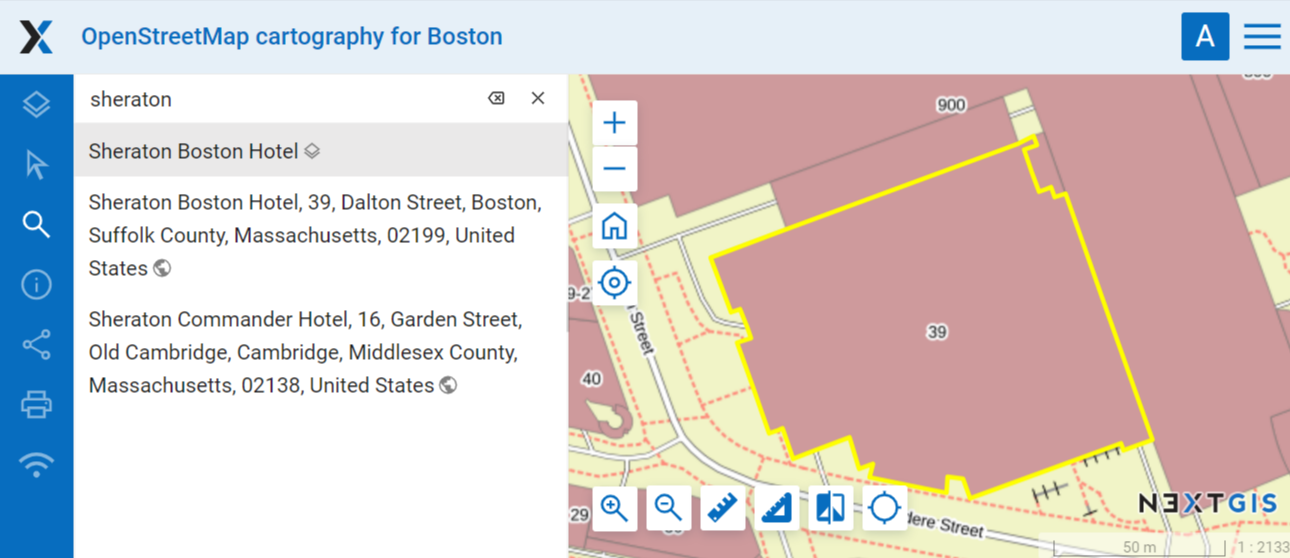
Fig. 531. Feature selected in search results is displayed on the map#
Search by coordinates#
To find a point using the coordinates, enter the latitude and longitude in degrees, minutes and second, degrees and decimal minutes or decimal degrees (make sure to use straight single and double quotes), for example:
79 W 43 N
W 79 N 43
-79 43 (the results will contain two points: 79 W, 43 N and 43 E, 79 S)
79- 43
-79 W 43 N
79°4'14.08" W 43°4'59.37" N
-79°4'14.08"  43°4'59.37"
-79 4.25 W  43 4.95 N
-79 4.25  43 4.95
79.068493 43.079920
79.068 W 43.08 N
See how it works in our video:
Watch on youtube.
When the feature table is opened on the Web Map, you can filter features by area (read more).
Basemap#
To change a basemap use the dropdown list (see Fig. 514.). By default you can select:
OpenStreetMap
None - disable the basemap so that a white background is shown instead.
You can add other basemaps, see the instructions in Adding resources.
Usually a basemap is shared by thrid-party services in the Internet. Users can not influence their content.
If the Internet access is expected to be poor or if the Web GIS is deployed in local network without access to the Internet, you can add base data as Web GIS layers (for example, a Tileset) or deploy NextGIS GeoServices to host your own basemaps.
Contact Web GIS owner#
User viewing a publicly available Web Map can send a message to the Web Map administrator.
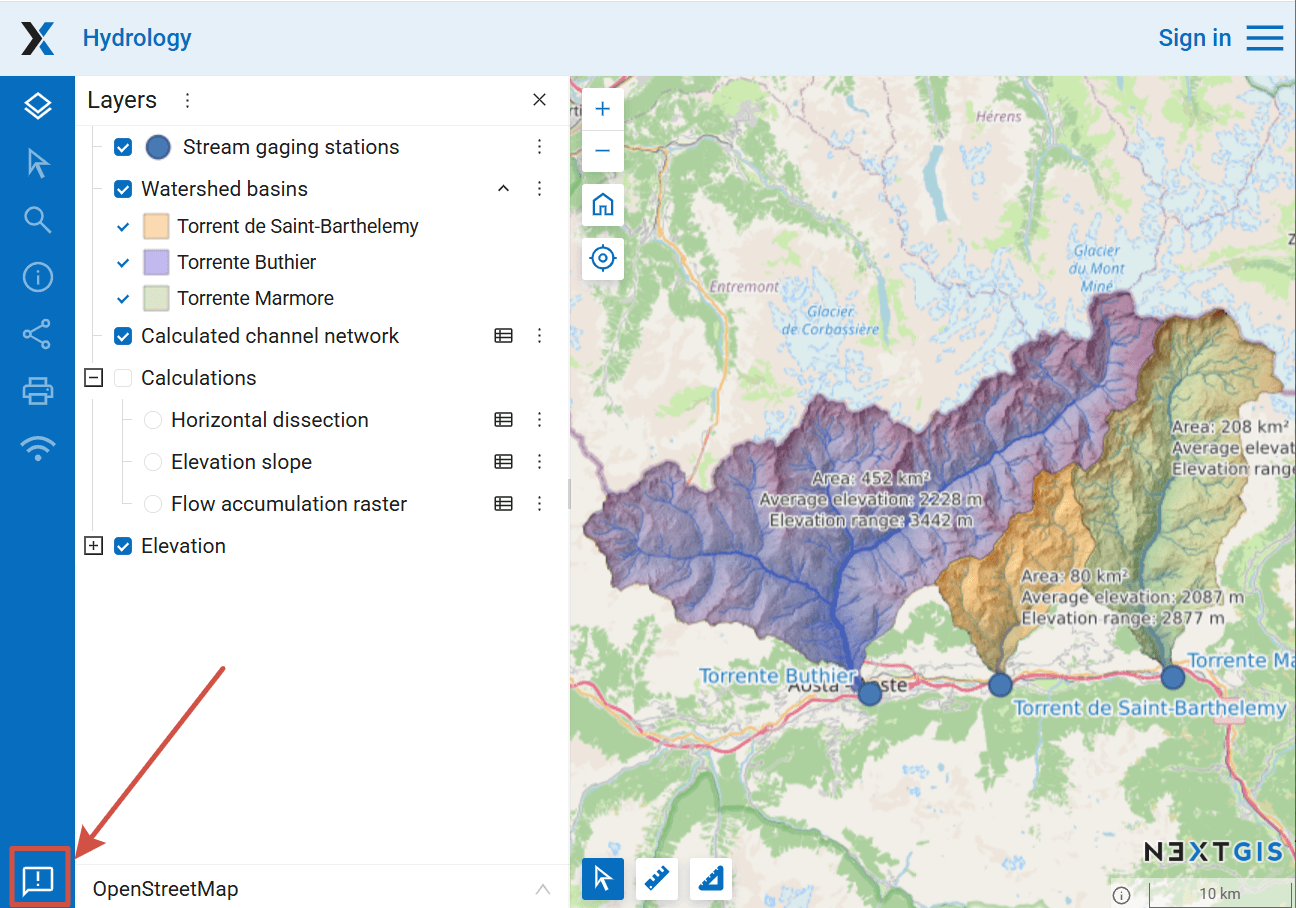
Fig. 532. Get in touch with Web GIS owner#
Clicking this icon redirects to the account page (you have to log in with your NextGIS ID). Fill the message form:
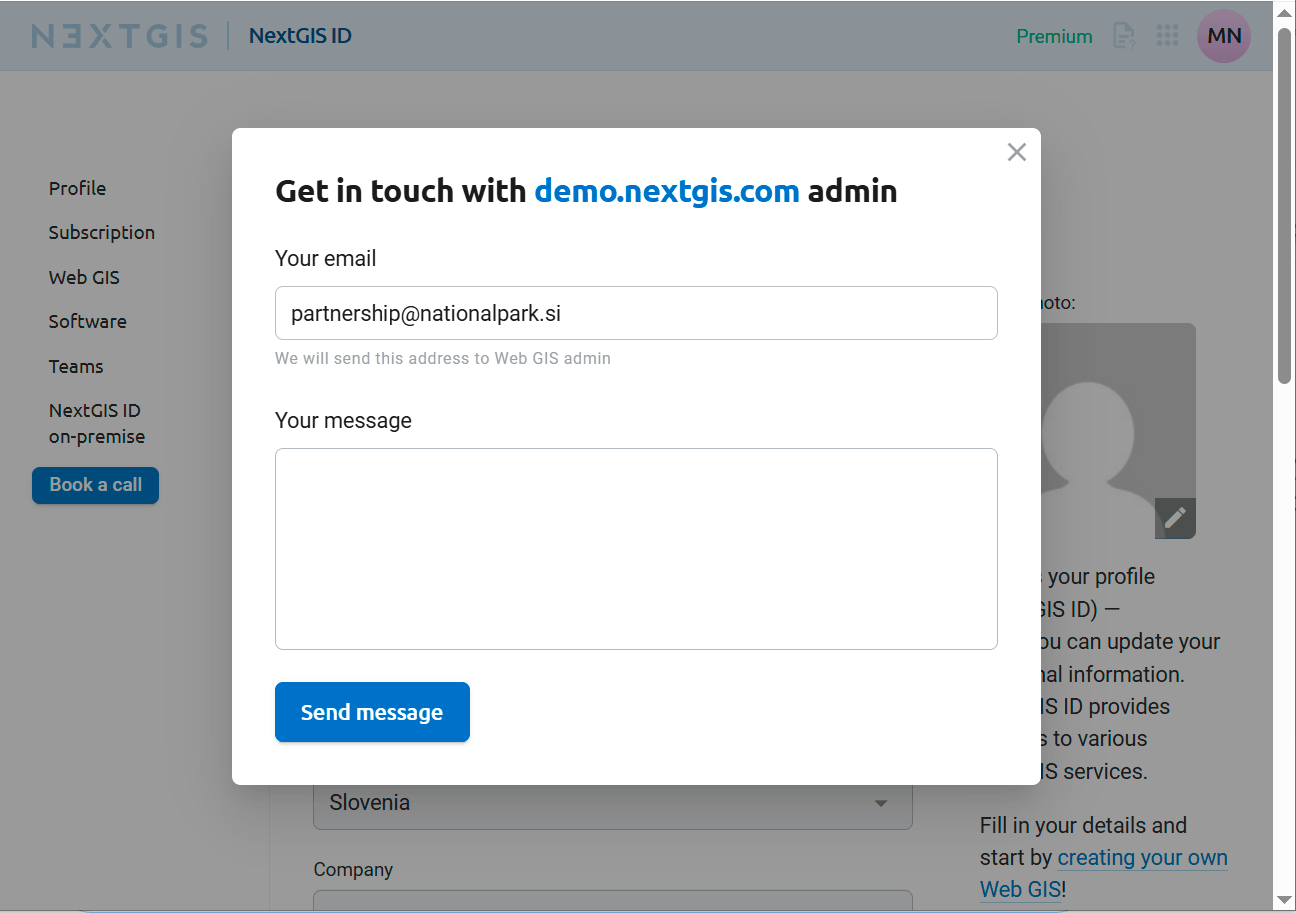
Fig. 533. Message form#
The Web GIS administrator will receive your message and email address so that they can reply by email.