User interface (UI)#
There are 4 major elements of NextGIS Mobile UI:
Main screen
Layers tree panel
Features table
Settings dialogue
UI is designed in accordance with Google Material design guidelines.
Main screen#
Main screen is shown on Fig. 903..
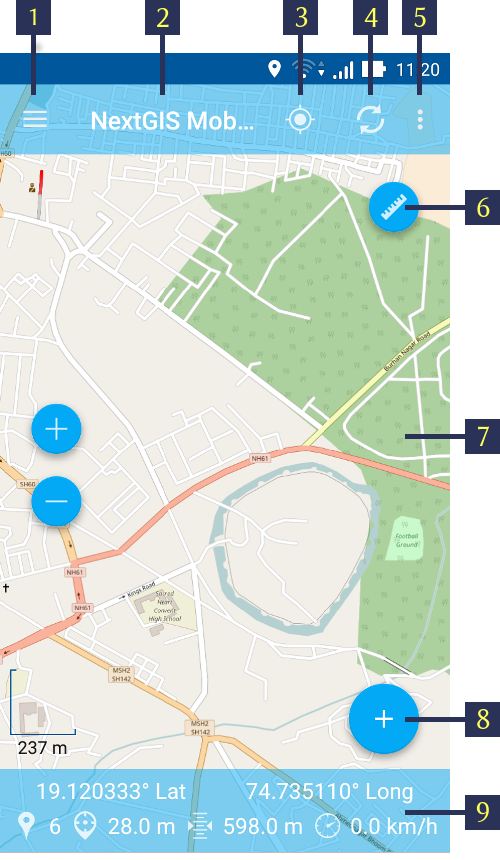
Fig. 903. Main screen#
The numbers indicate: 1 - Layers tree panel icon; 2 - Application title; 3 – “Show my location” button; 4 - “Load/Refresh geodata” button; 5 - Contextual menu icon; 6 - Measuring button; 7 - Map screen; 8 - Main actions button; 9 - Status info panel.
The number of buttons in top toolbar depends on your device screen size. If the buttons don’t fit into the toolbar they are moved to the contextual menu (item 5 in Fig. 903.).
Top toolbar contains the following buttons:
Show my location
Load or refresh geodata
Start new track
Settings
Help
Status info panel (item 9 in Fig. 903.) can be shown at the bottom of the Main screen (if it is activated in the Settings - Map - Show status info panel). Status info panel shows (if there is the fixed location):
Device coordinates (latitude and longitude);
Positioning signal source (mobile networks/Wi-Fi or satellite) and number of captured satellites (if positioning is carried out with help of GPS/GLONASS);
Device altitude (meters);
Device speed (kmph)
Depending on the size of the screen Status info panel can occupy one or two rows.
A map (item 7 in Fig. 903.) is a set of raster and vector layers. The order and the visibility of layers are under control of layers tree (Layers tree).
After a long hold of your finger on the vector layer’s geometry the map window turns to the select mode.
Layers tree#
Layers tree panel is designed to display the content of a map and to control visibility and hierarchy of map layers. Additional operations with layers are available from a separate layer contextual menu. Layers tree panel is shown on Fig. 904..
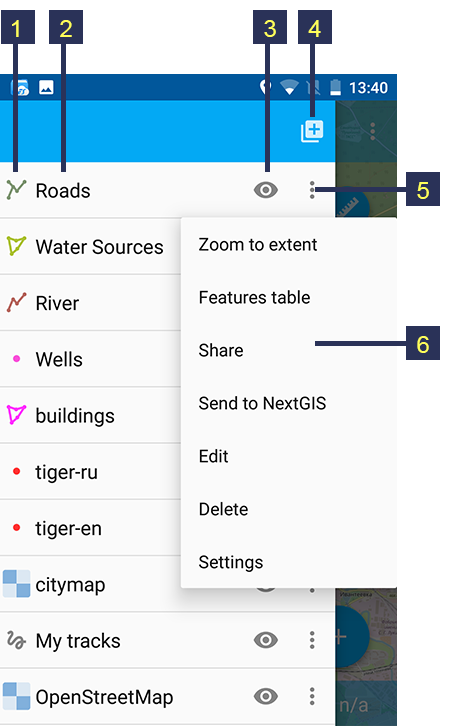
Fig. 904. Layers tree panel#
The numbers indicate: 1 - Layer type; 2 - Layer name; 3 - Layer visibility button; 4 - Add geodata; 5 - Layer contextual menu icon; 6 - Layer contextual menu items.
To change the hierarchy of map layers long-press the layer which is to be moved up or down. Layers tree panel will switch to Edit mode. Keep pressing and move the selected layer to its new position.
For turning layer visibility on/off tap on Layer visibility button (item 3 in Fig. 904.).
“Add geodata” button (item 4 in Fig. 904.) allows you to create vector layers and import vector and raster layers from Android local storage, QuickMapServices catalog, nextgis.com or NextGIS Web. This button contains the next menu (Fig. 905.):
Create layer;
Open local;
Add geoservice;
Add from NextGIS.
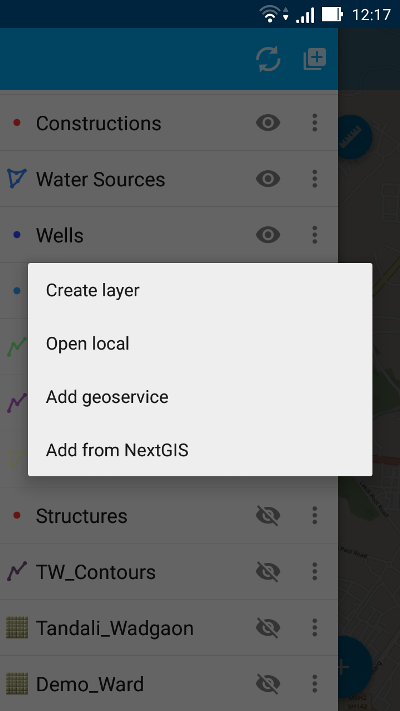
Fig. 905. Add geodata dialogue#
By using “Open local” menu item you can upload geodata from local storage in one of the following formats:
GeoJSON file;
ZIP file with cached tiles;
*.ngrc file
*.ngfp file.
More information about geodata upload can be found in “Adding layers” section.
Layer contextual menu depends on layer’s type (whether it is vector or raster layer). When you tap the Contextual menu button (item 5 in Fig. 904.) contextual menu items pop up as shown by item 6 in Fig. 904.
Zoom to extent
Features table
Share
Send to NextGIS
Edit
Delete
Settings
Warning
By pressing “Delete” you not only remove layer from the map but also erase all its data from the local storage.
Features table#
Features table is designed to show and manage the contents of each vector layer in table format.
To open Features table activate Layers tree panel and tap on the Contextual menu button next to the vector layer name (item 5 in Fig. 904.). This will pop up the contextual menu items as shown by item 6 in Fig. 904.. There you need to select “Features table”. Depending on the screen size the panel could occupy the whole screen or just the right side (in this case there is a map with a highlighted geometry of the current attributes on the left side).
Features table opens as shown in Fig. 906. below.
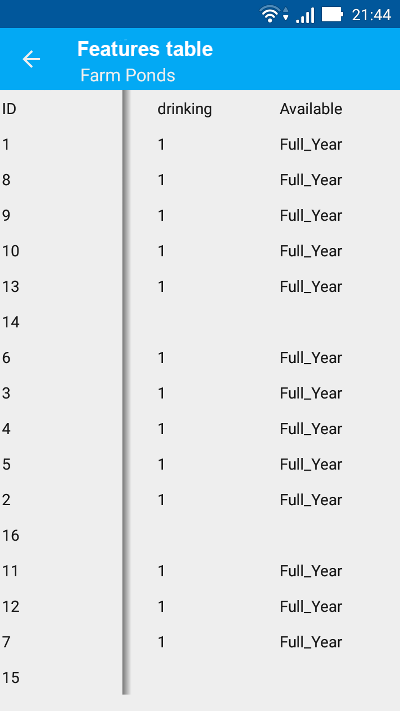
Fig. 906. Features Table#
If you tap any record (row) in the table, the Features table toolbar appears at the bottom of the screen. This toolbar allows to manage features as shown below in Fig. 907..
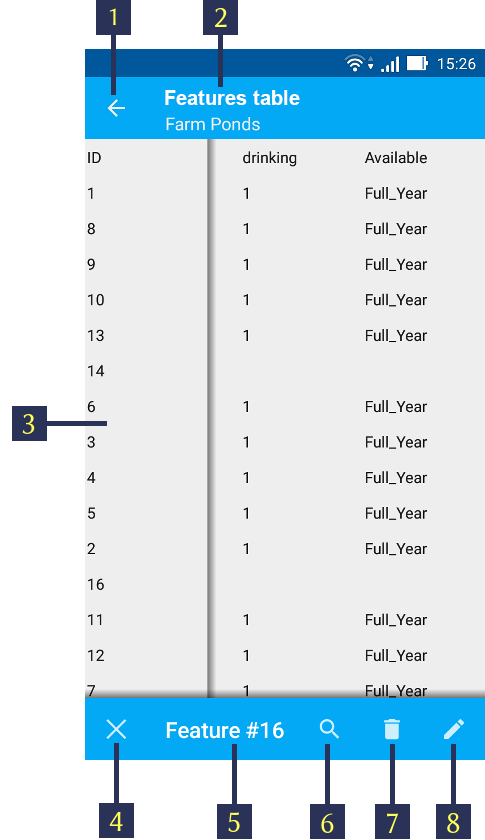
Fig. 907. Features table toolbar#
The numbers indicate: 1 - Close Features table; 2 - Layer name; 3 - Features attributes; 4 - Close toolbar; 5 - Selected feature ID; 6 - Show selected feature on the map; 7 - Delete selected feature; 8 - Open Features table editing form.
You can open the standard Features table editing form as shown in Fig. 951. by selecting “Open Features table editing form” (see item 8 in Fig. 907.)
Warning
If you tap on “Delete” button (see item 7 in Fig. 907.), the system will delete the selected feature immediately. You will be able to undo the removal, but if undo action is not applied in 5 seconds after removal, the feature gets deleted permanently.
You can search by attribute values. See how it works in a video:
Watch on youtube.
Useful features#
From the Main screen itself you can access a couple of features useful in the field.
Show my location#
To know your current location, just tap on the “Show my location” button (see item 3 in Fig. 903. above). This will show your current location on the map screen with a marker. If your Status info panel (see item 9 in Fig. 903. above) is switched on via appropriate Map settings (see Fig. 911.) you’ll also be able to view the relevant information there.
Note
Your “Location” settings must be switched ON in your Android mobile settings.
Measure distance and area#
It is possible to measure the distance between two points directly on the map screen. Just tap on the Measuring button on Map screen (see item 6 in Fig. 903. above). Tap on your starting point (a new point in Edit mode will appear on the screen). Then tap on your finishing point (a second point in Edit mode and line between the points will appear on the screen). The distance between two points will be shown in Top toolbar. See Fig. 908. below for illustration.
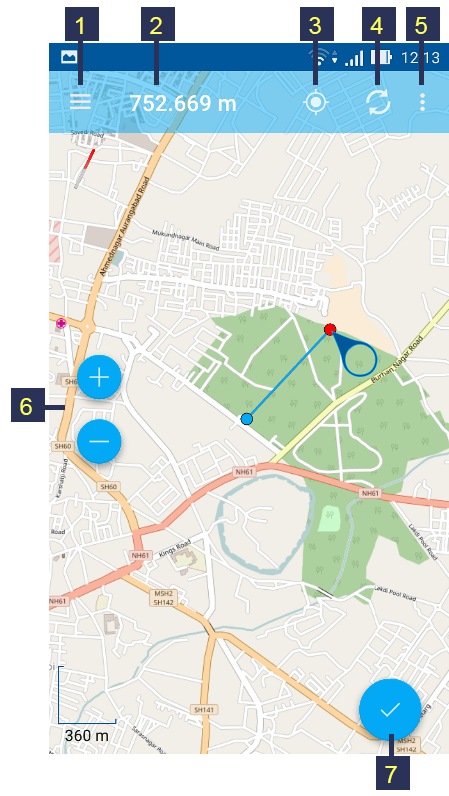
Fig. 908. Measure distance#
The numbers indicate: 1 - Layers tree panel icon; 2 - Measured distance; 3 - “Show my location” button; 4 - “Load/Refresh geodata” button; 5 - Contextual menu icon; 6 - Zoom controls; 7 - Exit Measuring mode.
Position of any point may be edited by tapping on it and dragging it to the correct location.
You can add additional points to measure distance of angled lines and smooth curves, as well as measure areas of the formed polygons.
To exit Measure mode tap the blue tick button in the corner of the screen (see item 7 in Fig. 908.).
Note
To use this feature “Show measuring button” checkbox must be switched ON in Map settings (see Fig. 911.).
View feature information#
Make a short tap on a feature and a tool bar will appear at the bottom on the screen. The only active option will be “info” (i in a circle). Press it to view the attributes and attachments of the feature. You can download and view photos previously attached to the feature and stored in the cloud.
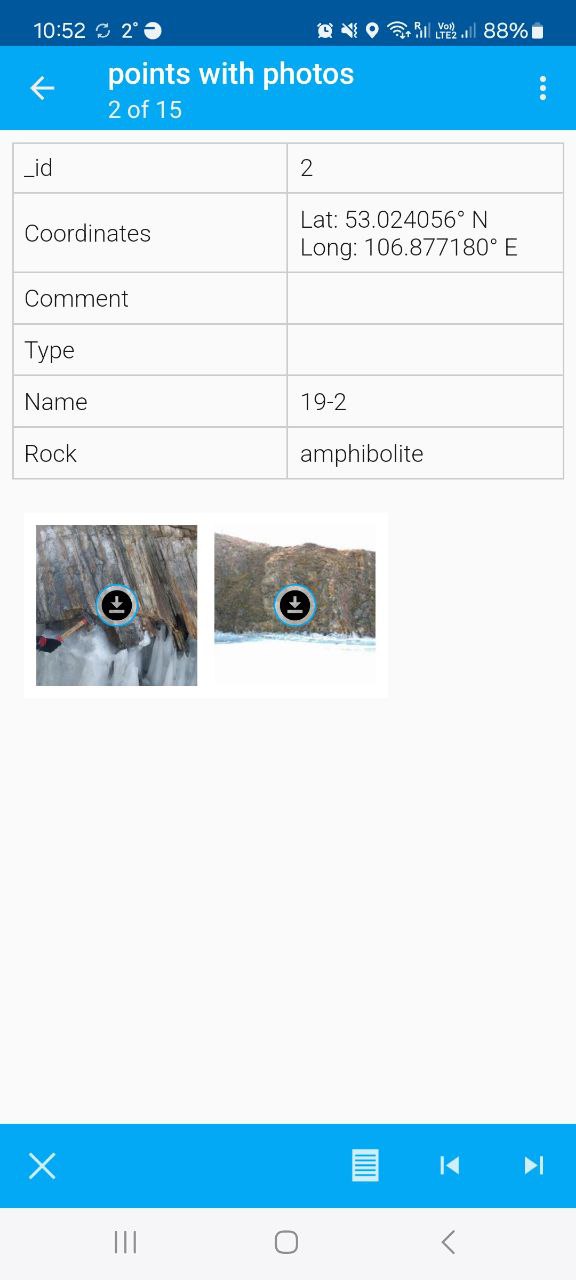
If there are several features at the point you tapped, a list to choose from will appear.