Wurman Dots#
Note
Qt6 compatible
Create Wurman dots using a square or hexagonal grid.
Wurman Dots is a method for visualizing the density of a point layer. The area is split into cells, each of them is then marked by a circle. The inner circle vary in size representing the density of objects within each corresponding grid cell.
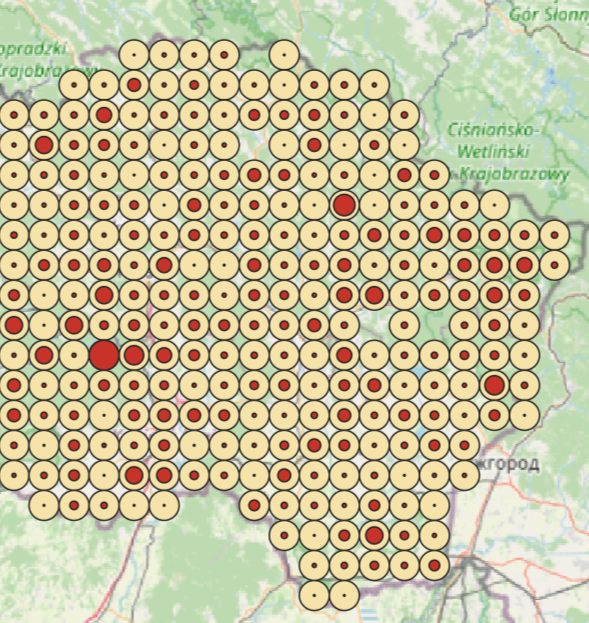
Fig. 838. Result: square grid with 10000 m cells#
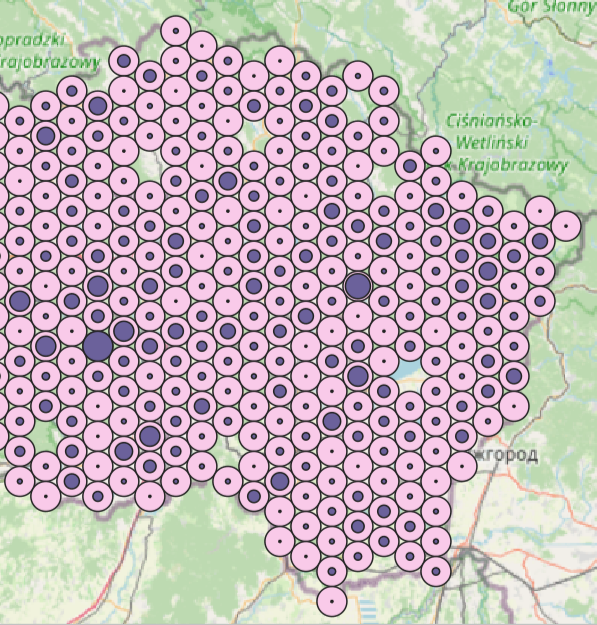
Fig. 839. Result: hexagonal grid with 10000 m cells#
After installation you can find the plugin in the Vector menu. It has two options of grid generation, one creates a grid based on cell size, the other - based on cell count.
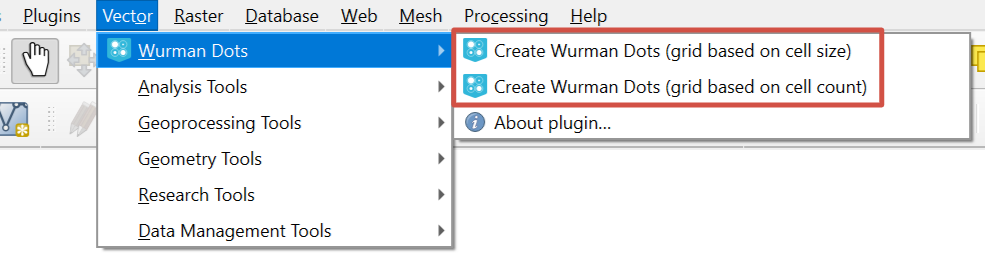
Fig. 840. Opening plugin#
Settings:
Select a point layer (EPSG:3857 only), it is the only required field, for the other fields you can use default settings;
You can apply the algorithm to the selected features only by ticking this option;
Configure cell parameters (depending on the grid generation method):
Set the grid cell size in meters (the default is 50000), OR
Set the number of cells along the shorter side of the extent (the default is 10);
Select grid type (square or hexagonal);
If you want to create circles in the cells that have no points in them, tick “Create continuous grid of fixed circles”;
Enter paths to output files if you wish. By default, temporary layers will be created.
If you don’t want to add the resulting layers to the map, untick “Open output file after running the algorithm”.
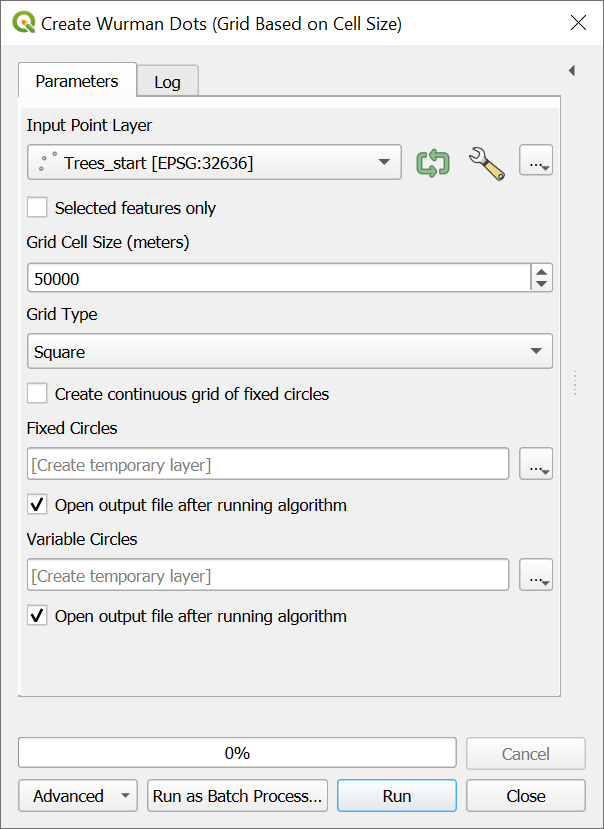
Fig. 841. Generating grid based on cell size#
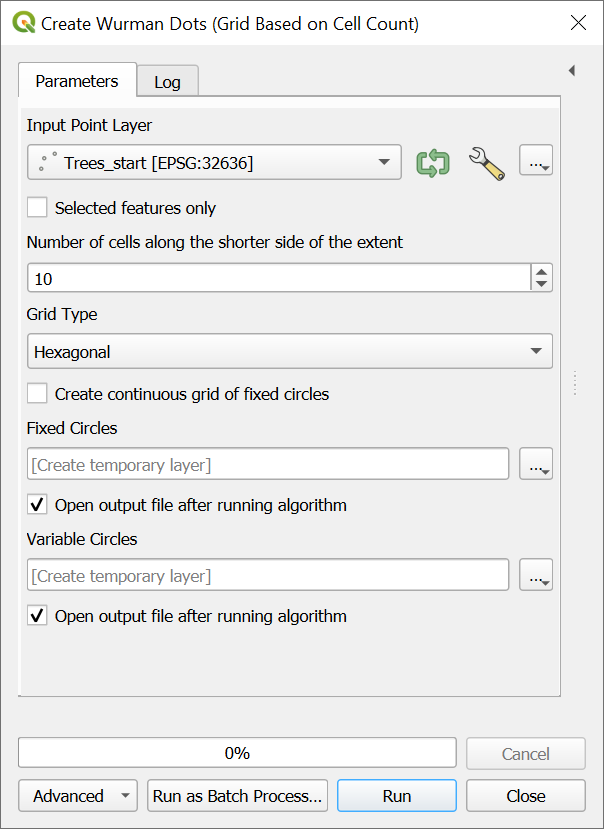
Fig. 842. Generating grid based on cell count#
The fixed circles and density circles are separate vector layers. For each of them you can modify color, opacity and other style parameters.
See how the plugin works in our video:
Watch on youtube.