Styles#
Style is a type of NextGIS resource that describes a way to render the geodata. Styles are necessary to display geodata on a Web Map.
Style is related to a particular layer, so you can only create a style resource from the page of a layer resource.
For a Vector layer, you can:
set up custom style parameters in the web interface;
copy an existing style.
For a Raster layer, you can:
upload a file in QML or SLD format;
set up the bands in the interface;
You can get some inspiration, as well as ready-to-go style files and projects in our Style Gallery.
Watch on youtube.
Formats#
By now NextGIS Web supports two rendering libraries: QGIS and MapServer.
QGIS style can be uploaded from a QML file or created in Web GIS, it has much more settings.
You can write MapServer style yourself as a text.
QGIS Vector Style#
Open the properties page of the layer you want create style for. To create a default QGIS style, just press the blue button on the resource page of the layer.
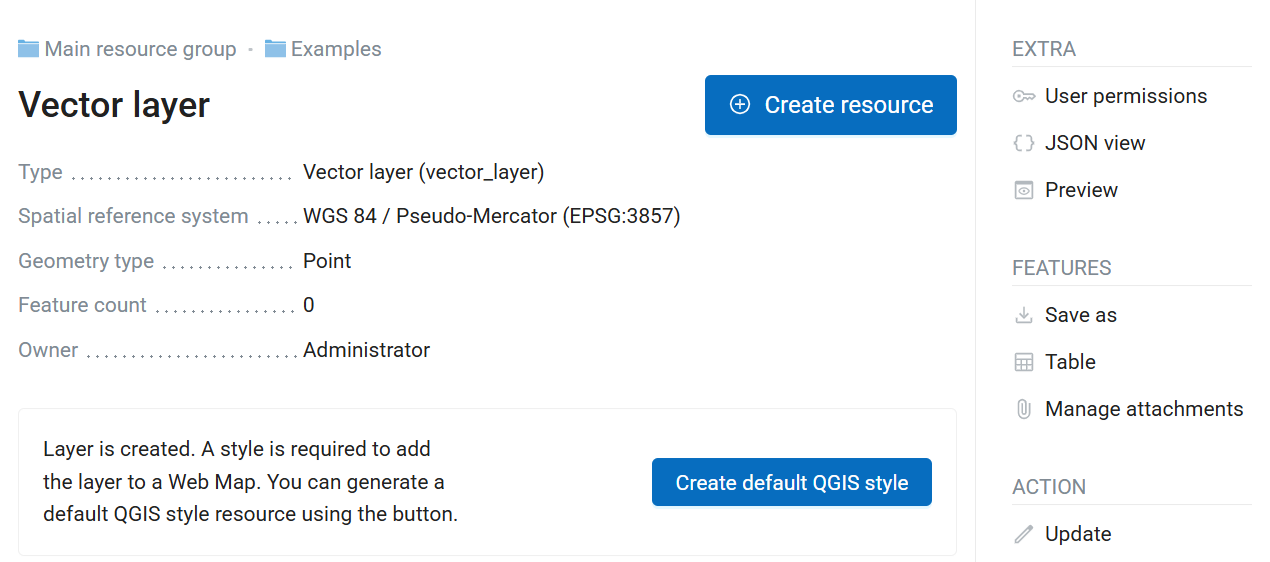
Fig. 380. Creating default QGIS style#
If you want to add a customized style, press Create resource button and select “QGIS vector style” (see Fig. 381.).
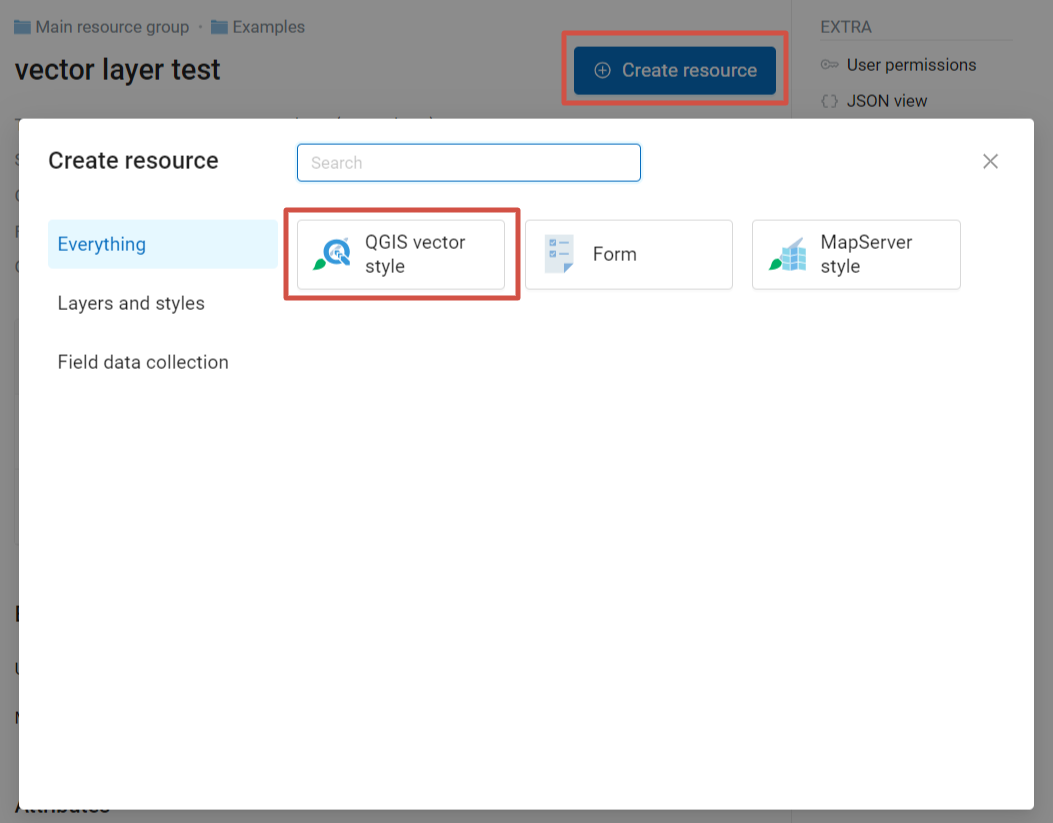
Fig. 381. Selecting QGIS style resourse#
After the selection of “QGIS vector style” create resource dialog will open.
You can upload a file or create a simple vector style in the dialog.
QGIS style from file#
To upload a pre-made style click Select a style on the “QGIS style” tab or drag a file to this field (see in Fig. 382.).
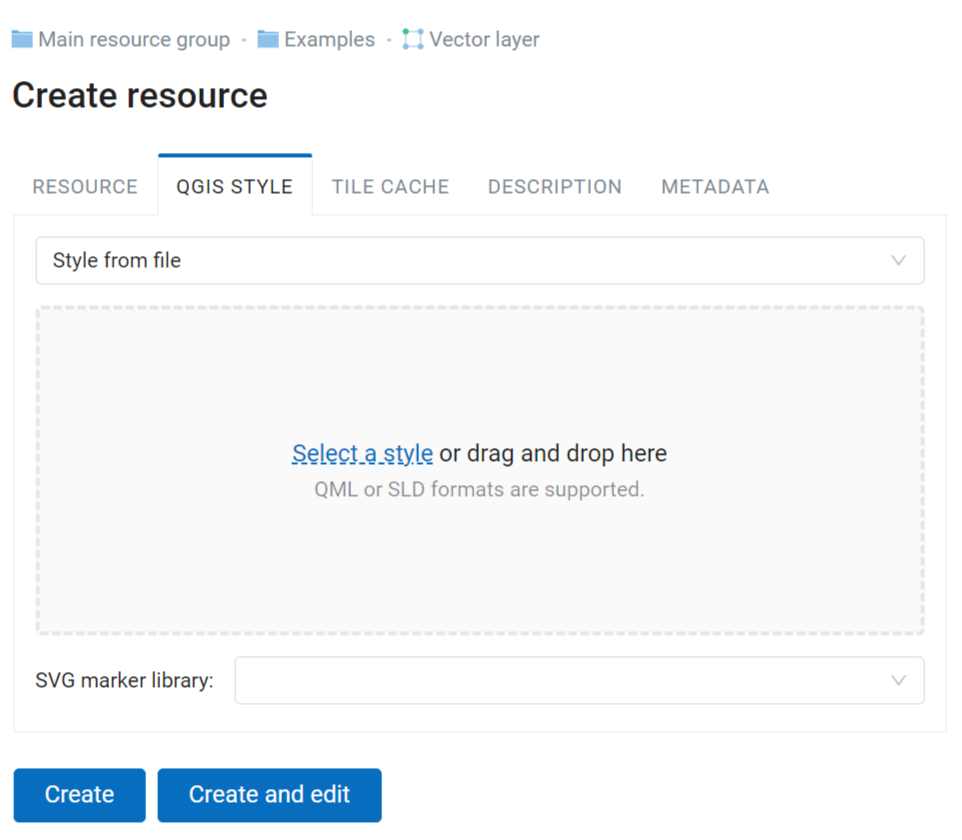
Fig. 382. Uploading QML file#
You can type a custom display name for the new style in the Resource tab. You can also add resource description and metadata on the corresponding tabs. Tile cache settings are described in details in this section.
After the QML file is uploaded click Create. After the style is created, its resource page opens (see Fig. 383.).
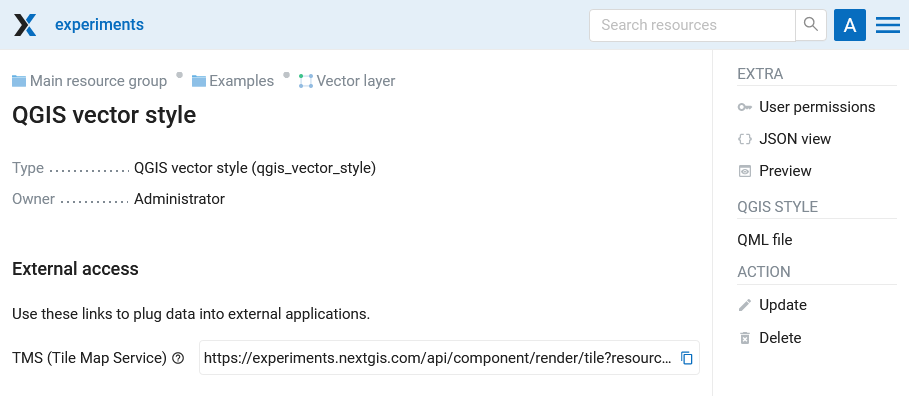
Fig. 383. QGIS style resource page#
You can replace the QML file of a style.
Copy style from existing resource#
You can use a style that is added to another layer in your Web GIS. Select Copy from resource from the dropdown menu.
Click on the “Source” field and select the style you want to copy.
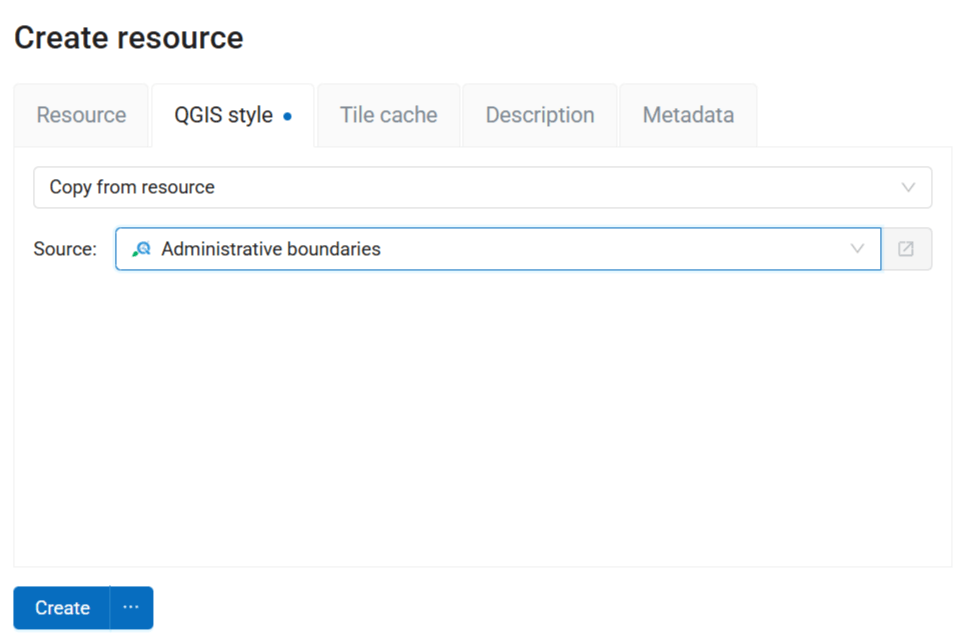
Fig. 384. Creating style by replicating an existing style resource#
Click Create to finish.
A new style is created, identical to the source style.
SVG markers#
There are several ways to add custom markers to a style for NextGIS Web:
Embed marker file into QGIS style.
Watch on youtube.
Publish the image file online and use its URL as the path to SVG marker.
Watch on youtube.
Add SVG marker library to your Web GIS.
To create a style using SVG markers from a library resource, you need to specify the SVG marker type in the layer properties in QGIS and enter the full path to the file on the local machine (Fig. 386.). The file name must match the one loaded in the SVG Marker Library resource that the user selects when loading the QML file.
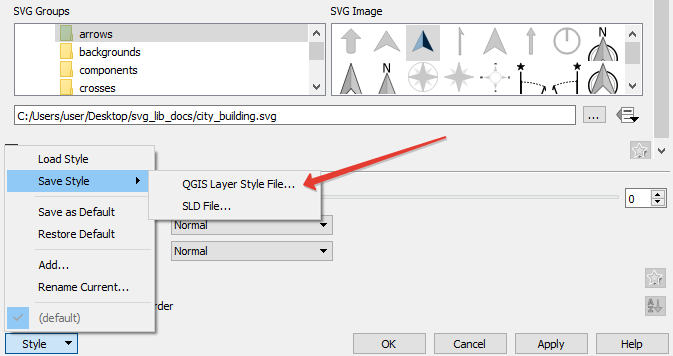
Fig. 385. Save QML file in NextGIS QGIS#
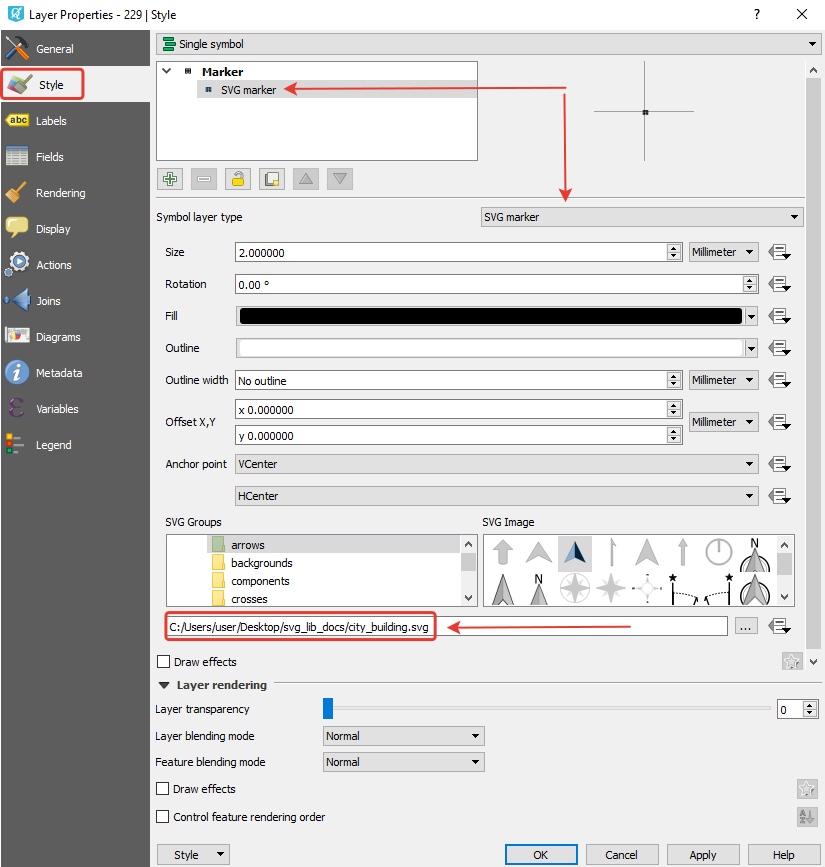
Fig. 386. Layer properties settings in NextGIS QGIS#
SVG Marker Library#
In Web GIS you can create SVG marker libraries to be displayed using QGIS styles of vector layers. Press Create resource button and select SVG marker library (see Fig. 387.).
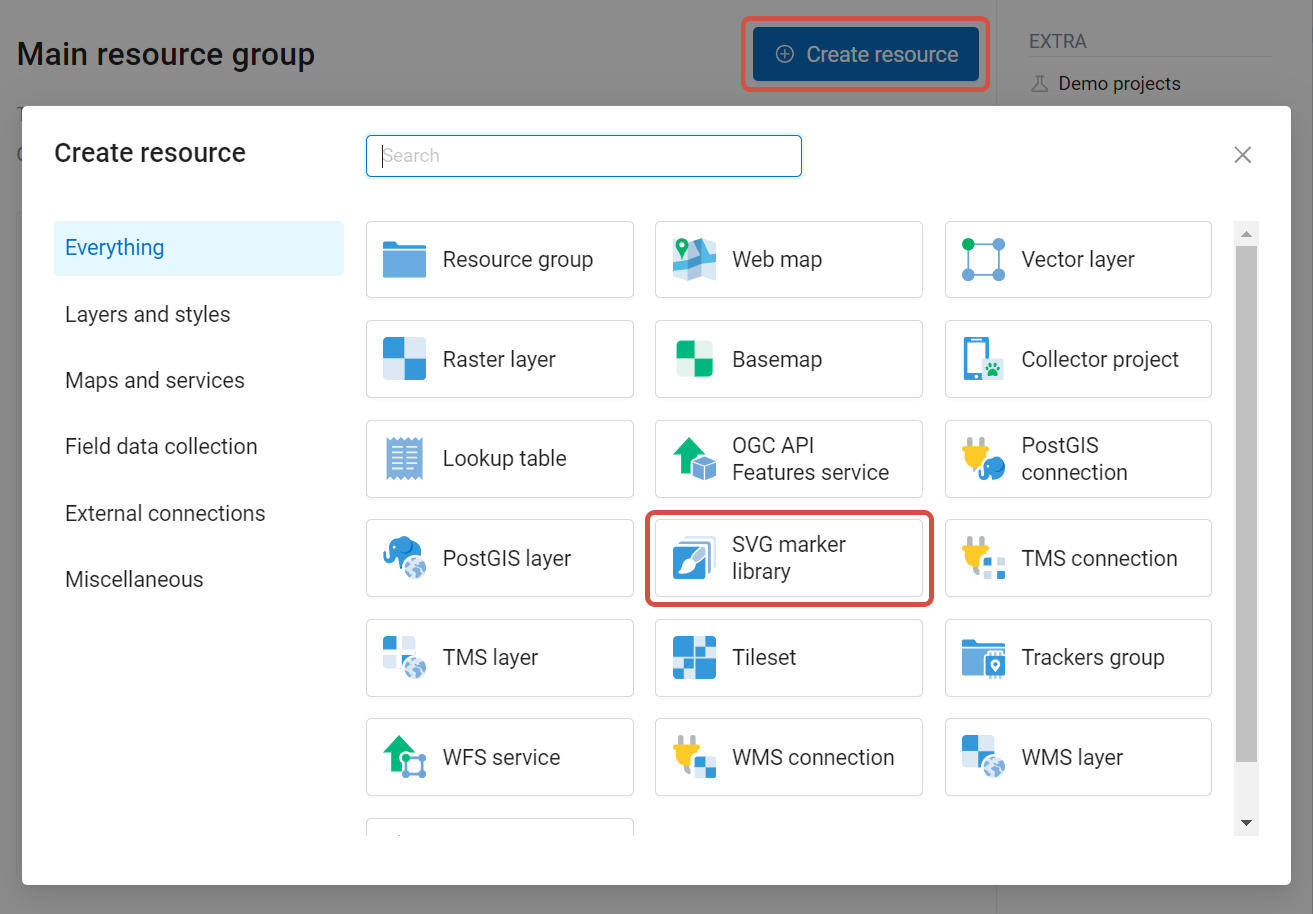
Fig. 387. Selecting SVG marker library resource type#
In the opened window, enter the name of the resource (see Fig. 388.).
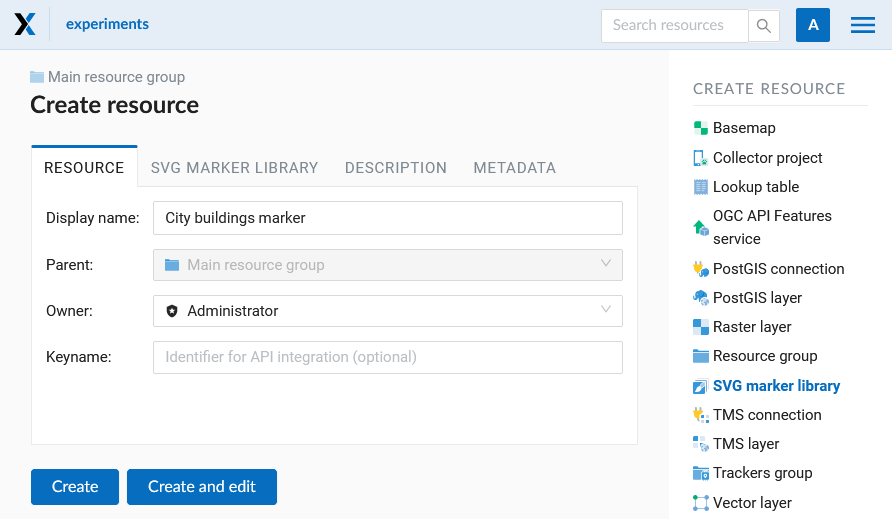
Fig. 388. SVG marker library name#
Add description and metadata on the corresponding tabs if you need them. Metadata is used in external apps working with API.
In the SVG marker library tab you need to upload SVG markers from your device. You can upload markers as individual files or as a zip-archive. The archive must contain only markers.
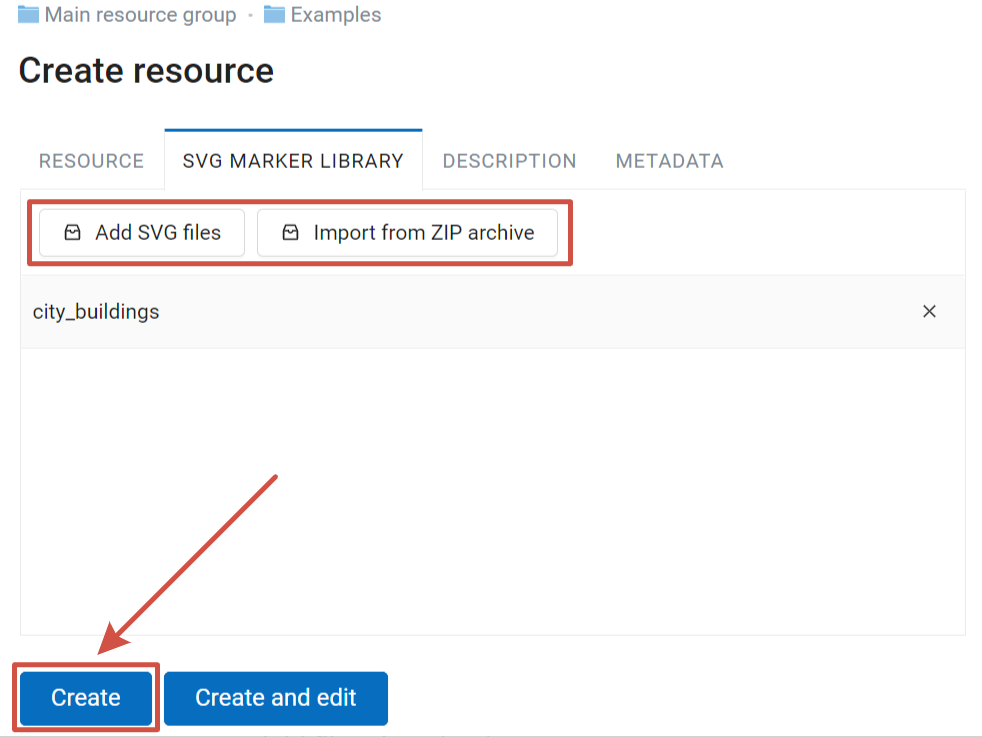
Fig. 389. Uploading SVG markers#
After all icons have been uploaded to the library, you will see the list of the file names. Click Create to complete the process.
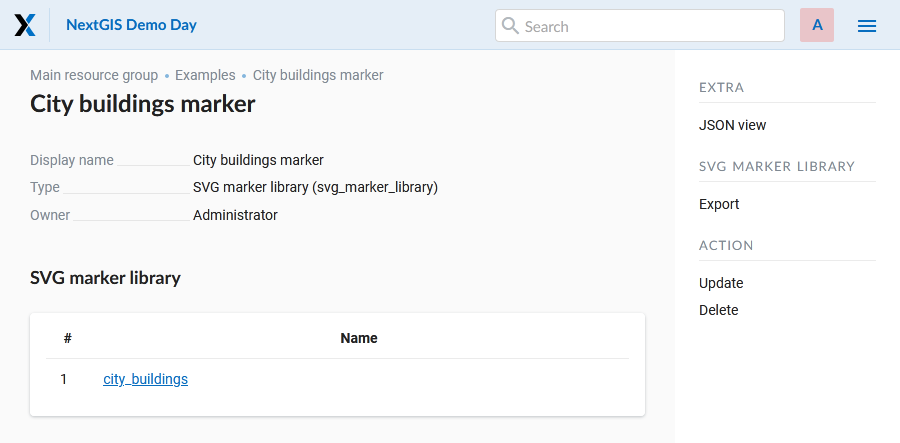
Fig. 390. List of SVG markers uploaded to the library#
Then create a style with the QML file and select the SVG library resource.
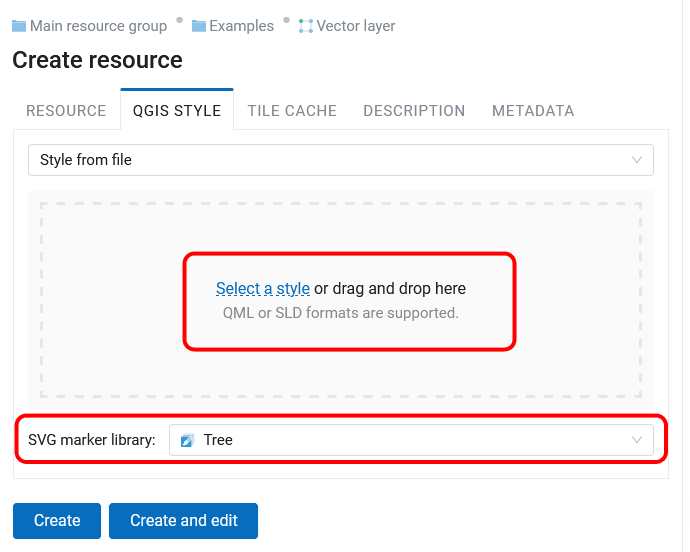
Fig. 391. QGIS style using SVG marker library#
SVG markers can also be embedded in a QGIS style. That way you wouldn’t need to create a separate library resource.
Custom QGIS style#
If you want to create a simple custom style, select “User-defined style” in the drop-down menu. You can set up:
Marker shape: square, circle, triangle, star, cross;
Marker size and stroke width. Enter a number or use the arrows in the field;
Fill color and stroke color and their opacity (by using sliders and eyedropper or entering values in HEX, HSB or RGB format);
The style of the line / polygon outline: solid, dotted, dashed, dash-dotted;
Labels (tick this option to view its settings): size, color and field selection.
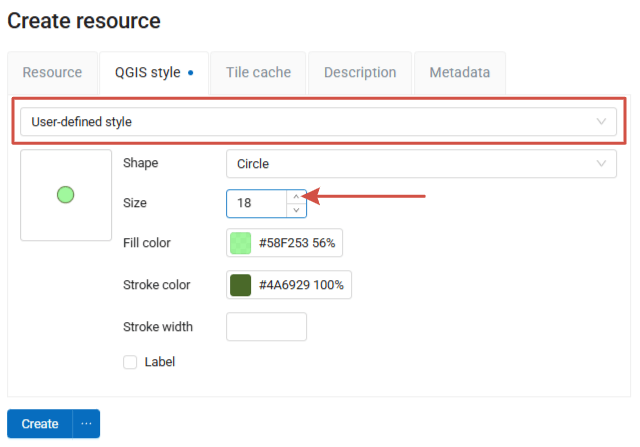
Fig. 392. Custom QGIS style for points#
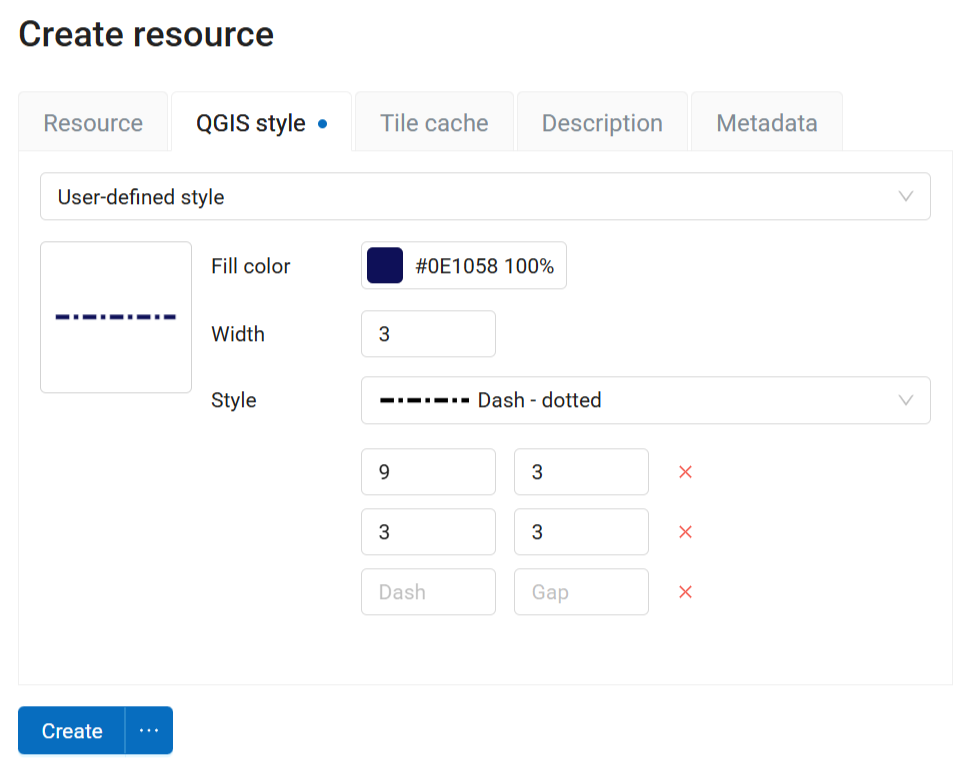
Fig. 393. Custom QGIS style for lines#
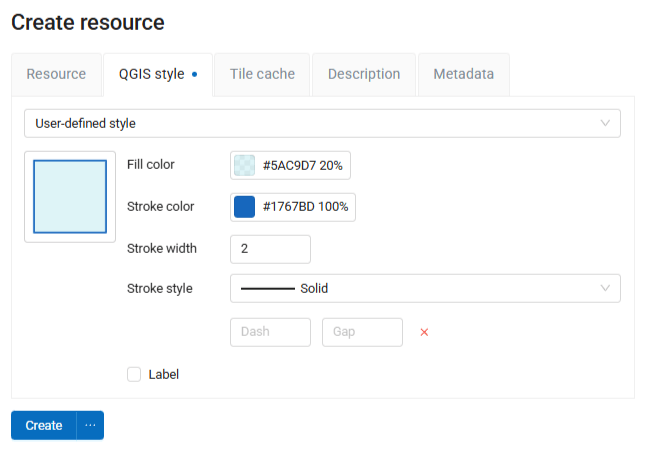
Fig. 394. Custom QGIS style for polygons#
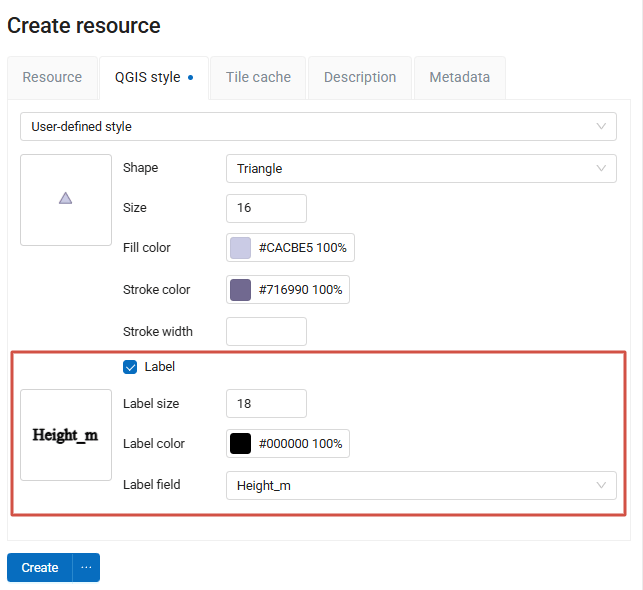
Fig. 395. Label settings#
You can type a custom display name for the new style in the Resource tab. You can also add resource description and metadata on the corresponding tabs.
When all the parameters are set, click Create. Then the window of QGIS style will open.
Styles created this way can be edited directly in NextGIS Web.
See how it works in our video:
Watch on youtube.
Editing QGIS style#
To edit a style click on the pencil icon by the style’s name in the layer tree.
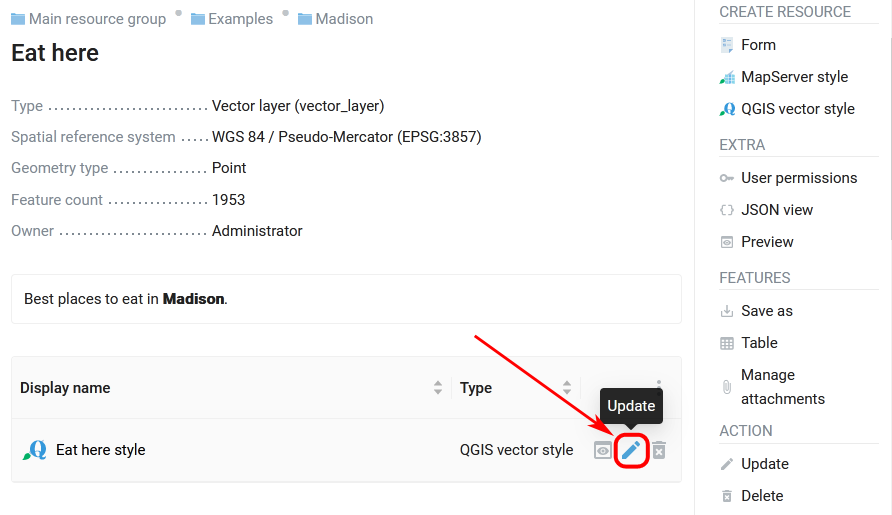
Fig. 396. Opening the Update resource dialog#
In the opened window you can replace the style by uploading a new file from your device. To do so, in the “QGIS style” tab select “Style from file” in the dropdown menu, then add a new QML or SLD file and click Save.
A simple QGIS vector style, the default style, for example, can be edited directly in NextGIS Web.
To do so, in the “QGIS style” tab select “User-defined style” in the dropdown menu. You can modify:
Marker shape
Marker size and stroke width (type it or use arrows in the field)
Fill color and stroke color and their opacity (by using sliders and eyedropper or entering values in HEX, HSB or RGB format)
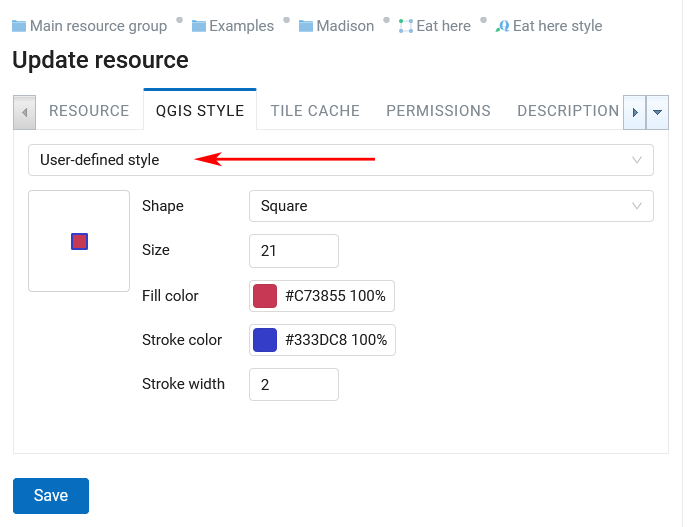
Fig. 397. Editing vector style marker#
MapServer style#
To create MapServer style open layer properties of the layer you want create style for. Press Create resource button and select “MapServer style” (see in Fig. 398.).
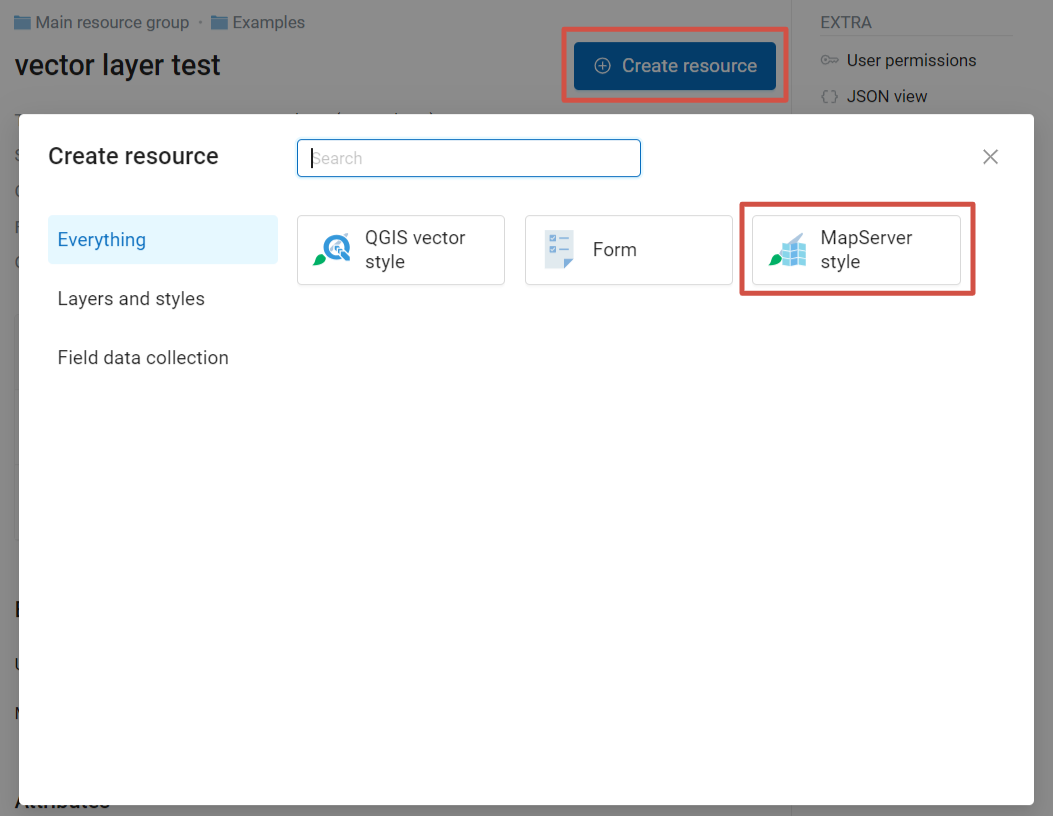
Fig. 398. Selecting MapServer style#
You can type a custom display name for the new style in the Resource tab. You can also add resource description and metadata on the corresponding tabs.
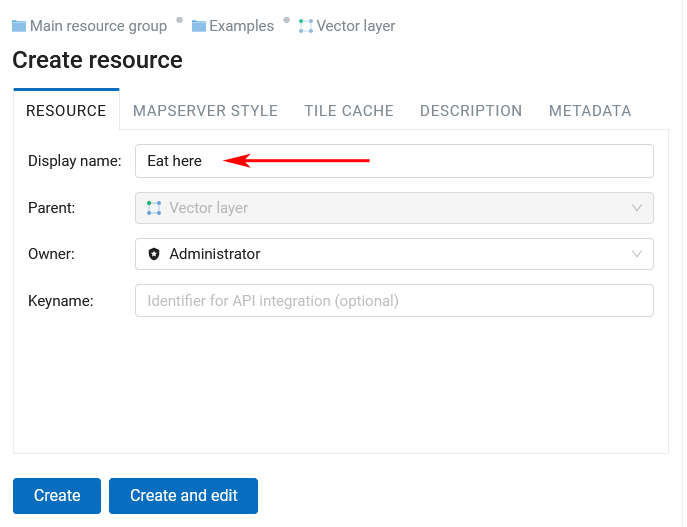
Fig. 399. Custom name for MapServer style#
Tile cache settings are described in details in this section.
In the “MapServer style” tab you can write a style manually (see in Fig. 400.). See MapServer templates and tags.
Otherwise default values are used.
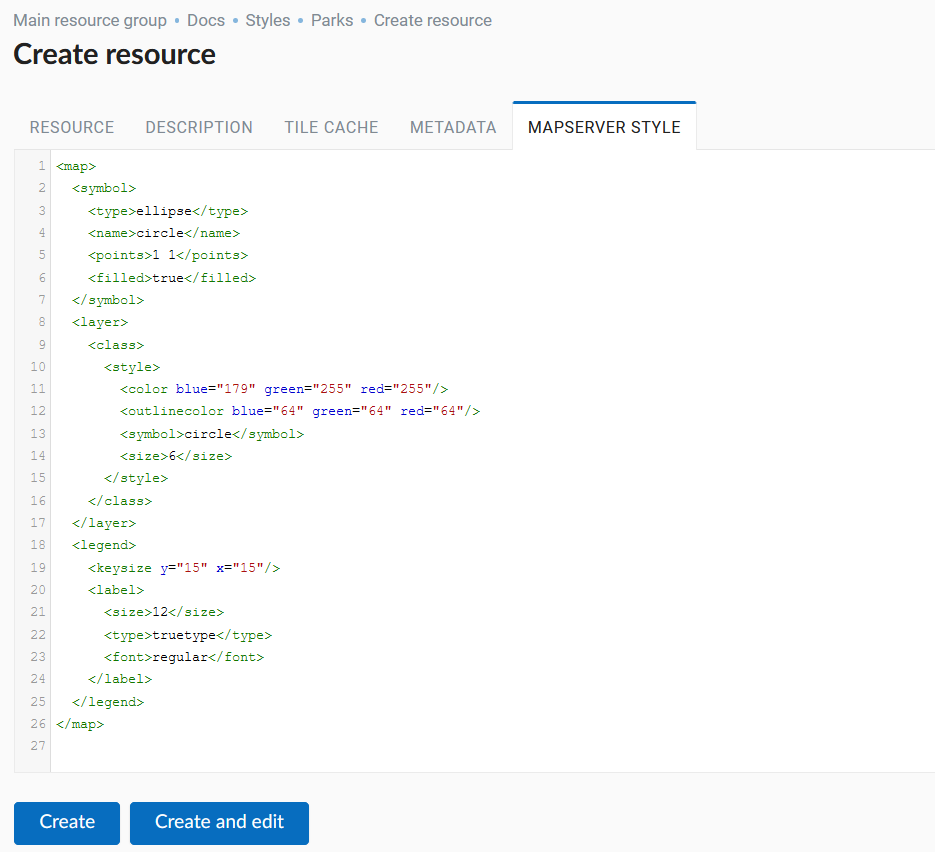
Fig. 400. “MapServer style” tab#
Click Create to finish the process. The window of the created MapServer style will open (see in Fig. 401.).
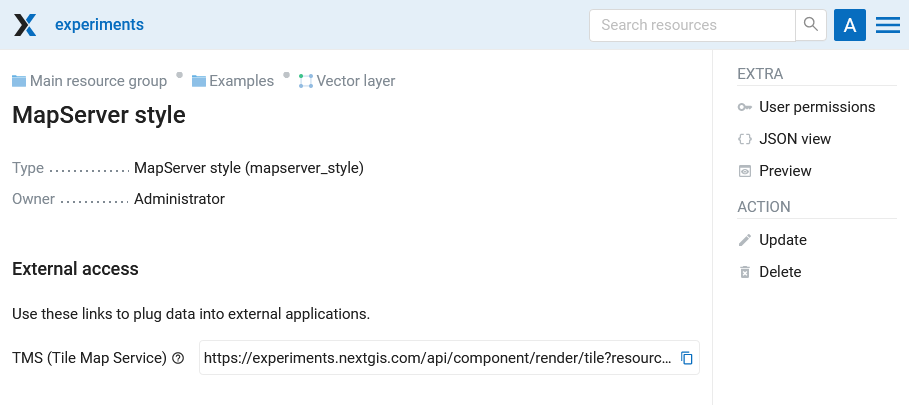
Fig. 401. MapServer style window#
Raster style#
After a raster file is successfully uploaded and a raster layer is created, you need to create a style to display it on a Web Map. There are several ways to create a raster style:
Create default QGIS raster style on the layer’s page.
Create default Raster style via Create resource button;
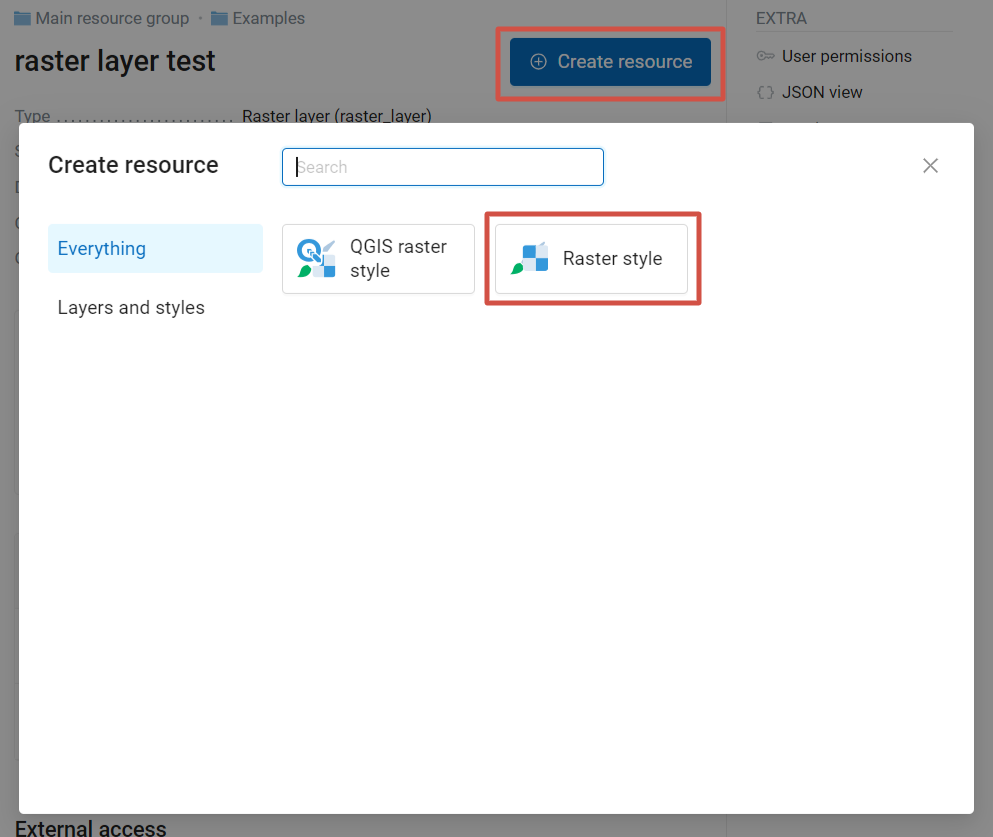
Fig. 406. Creating Raster style#
On the Tile cache tab you can enable cache, allow using tiles in non-tile requests, set up time after which the tiles expire (TTL) and max zoom level. To delete all previously created tiles of the style, check “Flush”.
Create QGIS raster style using Create resource button. In the dropdown menu you can select:
Style from file - select a QML or SLD file.
User-defined style - pick three channels, the values of these channels will be used to calculate a color in RGB model. You can set up min and max values for each channel;
Default style - allows to add a default QGIS style to a layer that already has styles;
Copy from resource - select a QGIS style of another raster layer to copy it.
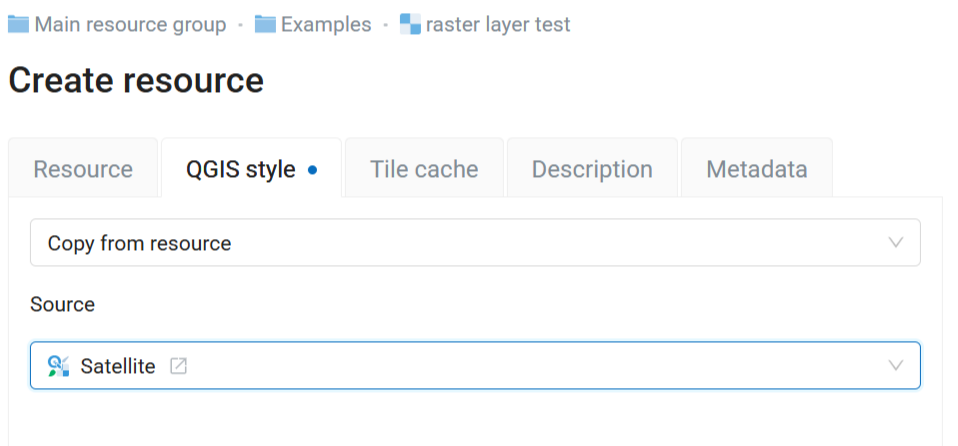
Fig. 407. Copying QGIS raster style#
You will need this style to add the raster to a Web Map.
Tile cache#
Caching provides faster rendering of Web Map layers. It can be enabled for vector and raster layer styles as well as for WMS and TMS layers.
To enable caching go to the Tile cache tab of the resource and check “Enabled”.
In the tile cache settings you can also configure the following parameters (see Fig. 408.):
Enabled checkbox;
Allow using tiles in non-tile requests checkbox - the requested image (not a tile) will be prepared from previously cached tiles (if available);
Input field Maximum zoom level - a threshold value, above which the cache is not accessed and the image is formed “on the fly”;
Input field TTL, sec (Time to live) - a time of storage of tiles on the server in seconds, after which the image will be formed again on the next request. TTL = 0 means that the storage time is unlimited;
Flush checkbox - write only - clears the tile cache when saving the style.
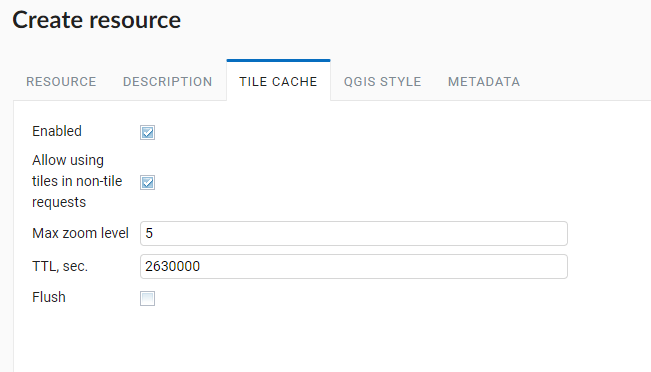
Fig. 408. Tile cache settings#
Adding a style on the map#
To edit a Web Map click pencil icon near it or click the Web Map and in actions pane “Action” select “Update”. In “Update resource” layer select Layers tab (see in Fig. 409.).
Here you can do the following actions:
Add layer
Add group
Remove layer or group
Modify the order of the layers on the map
Click “Add layer” and in opened window select the QGIS style of the layer, then click “OK”. After that click “Save”
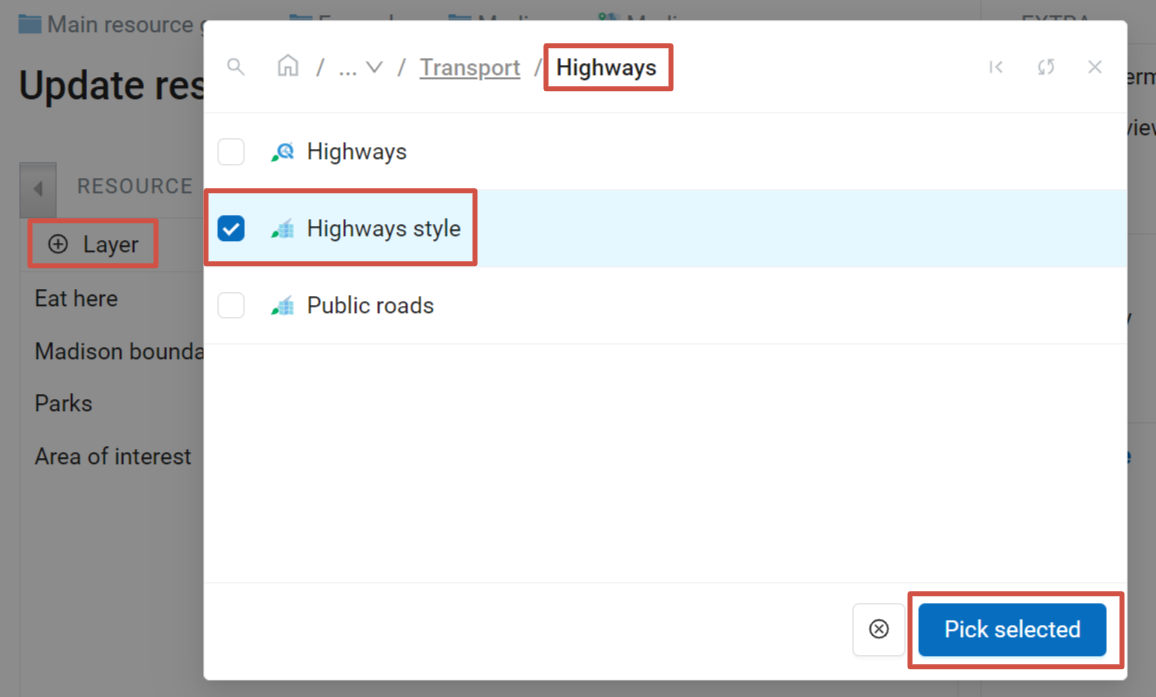
Fig. 409. Adding style on the map#
In the “Web Map” actions pane of the Web Map properties window select “Display”. The map will open, layers tree will be on the left. To hide/display a layer place a tick near the layer .
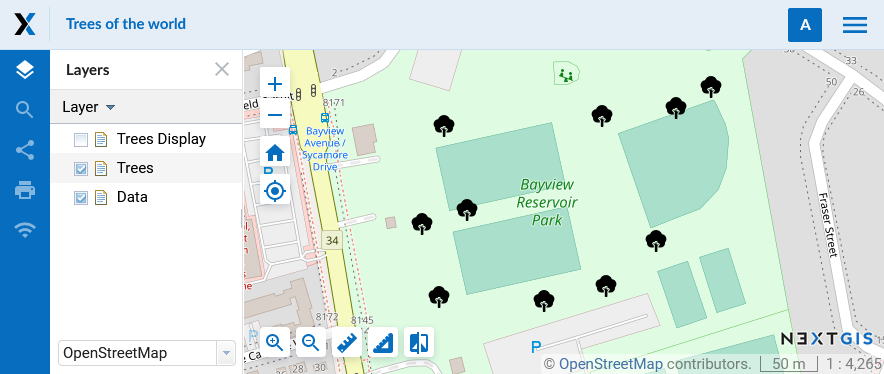
Fig. 410. Layer with special SVG markers in the QGIS style on a Web Map#