Tutorial: Seamless QGIS Integration#
Availability
Cloud SaaS (all editions), On premise (all editions), Open Source
NextGIS Web is a data-centric server GIS, that allows you to store, manage and publish spatial data in a flexible and effective way. It has a deep integration with QGIS, the leading free and open-source GIS software.
Integration covers publishing QGIS projects as Web Maps, connecting to Web Maps as QGIS projects, data syncing and collaborative editing from several QGIS instances.
In this step-by-step tutorial you will learn how to publish your QGIS project to the web, then connect to it from another QGIS instance, manage styles at Web Maps from QGIS and edit data from QGIS directly at the server. Register a free cloud account and try it right away!
Download tutorial data (source: OpenStreetMap, data.nextgis.com, Copernicus)
Publish your QGIS project online
Result: Explore the Web Map and resources
Use QGIS to edit data stored in Web GIS
Step 1/5 Create free account and Web GIS#
Go to my.nextgis.com, click the Create Account button and sign up using your email address.
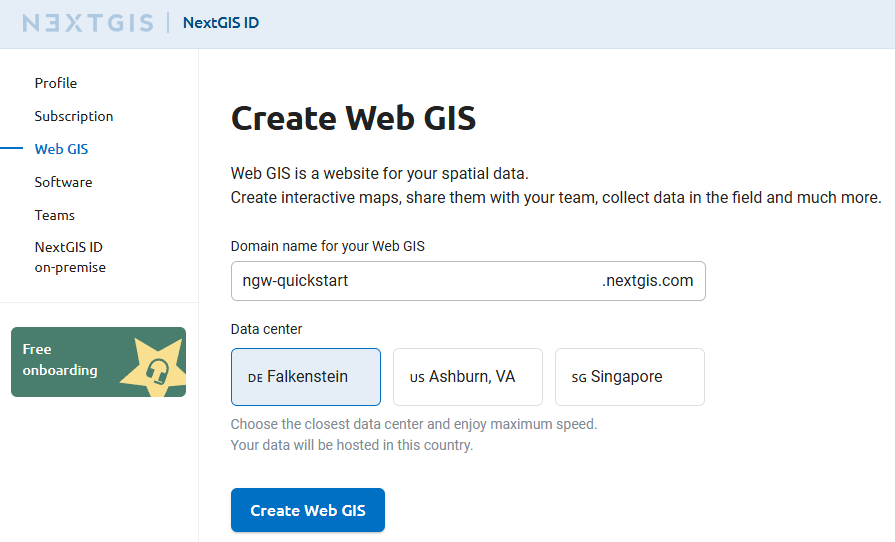
After registration your account page would appear. Select the Web GIS menu on the left, come up with a name (ngw-quickstart.nextgis.com in this example) and select the nearest Data center location (DE Falkenstein in this example). Then click Create Web GIS.
When the creation process is complete, the contents of the page will change. Direct link to your new Web GIS will appear.
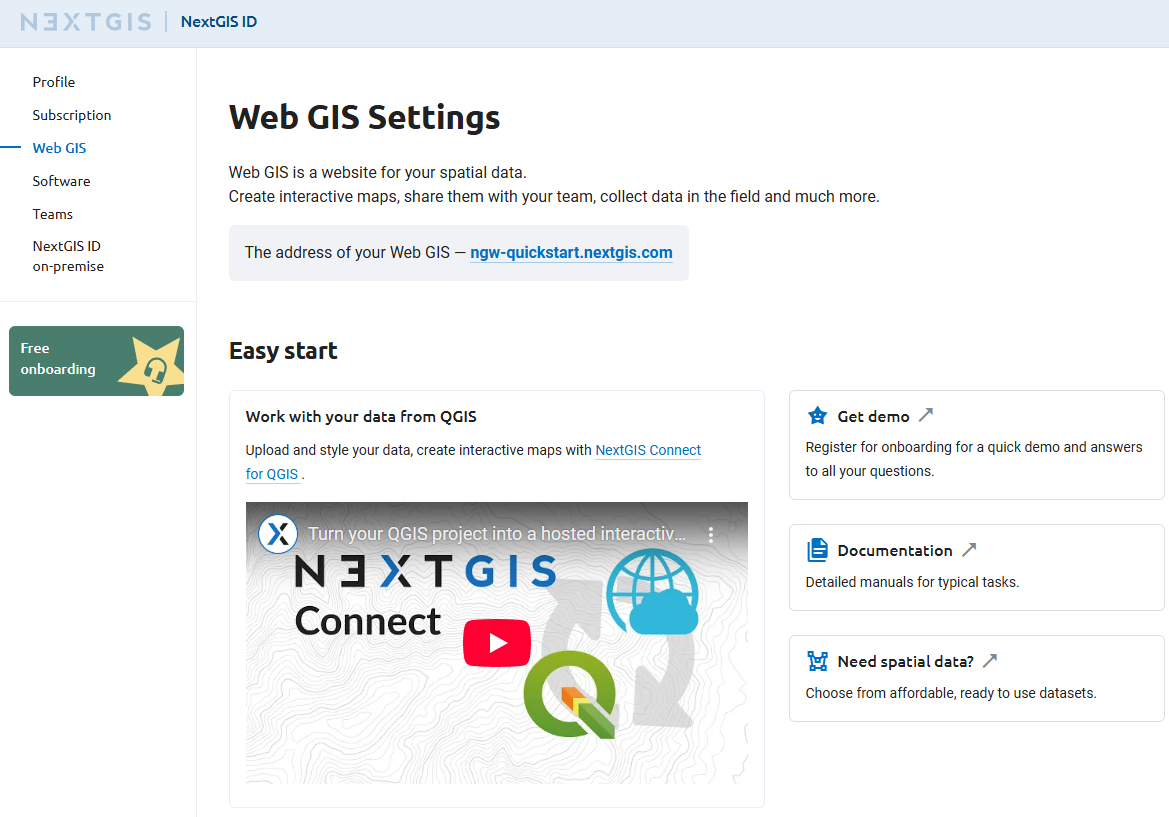
Copy the address of the created Web GIS. In this example: https://ngw-quickstart.nextgis.com. You’ll need it later to create a connection.
Step 2/5 Open and explore QGIS project#
Download the tutorial data and unzip the archive.
Click on the file called Sursee.qgz to open it in QGIS.
Note
If you don’t have QGIS yet, download and install it.
This is a typical QGIS project with raster and vector layers, a couple of basemaps and rich scale-dependent styles set up with exclickions. Points of interest are styled with advanced “Point Cluster” renderer using dynamic cluster symbol size. There are also embeded SVG icons in the “Road network” layer.
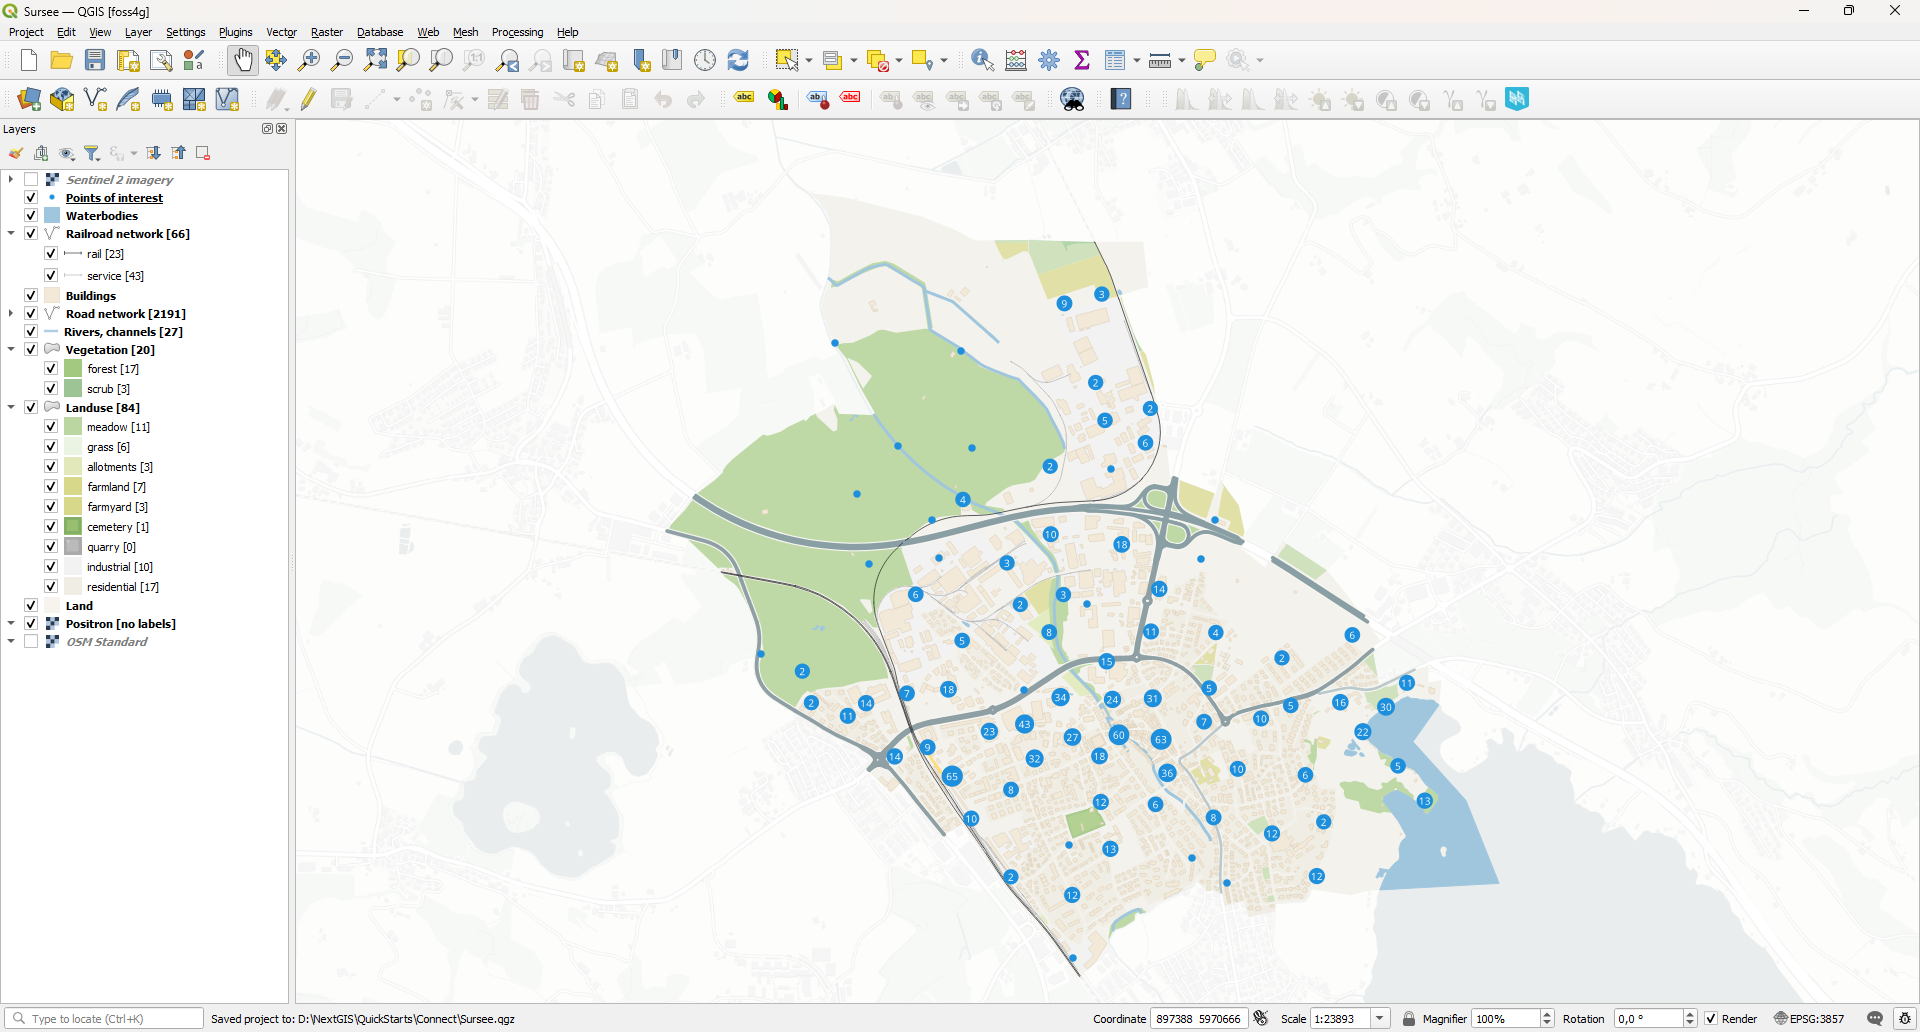
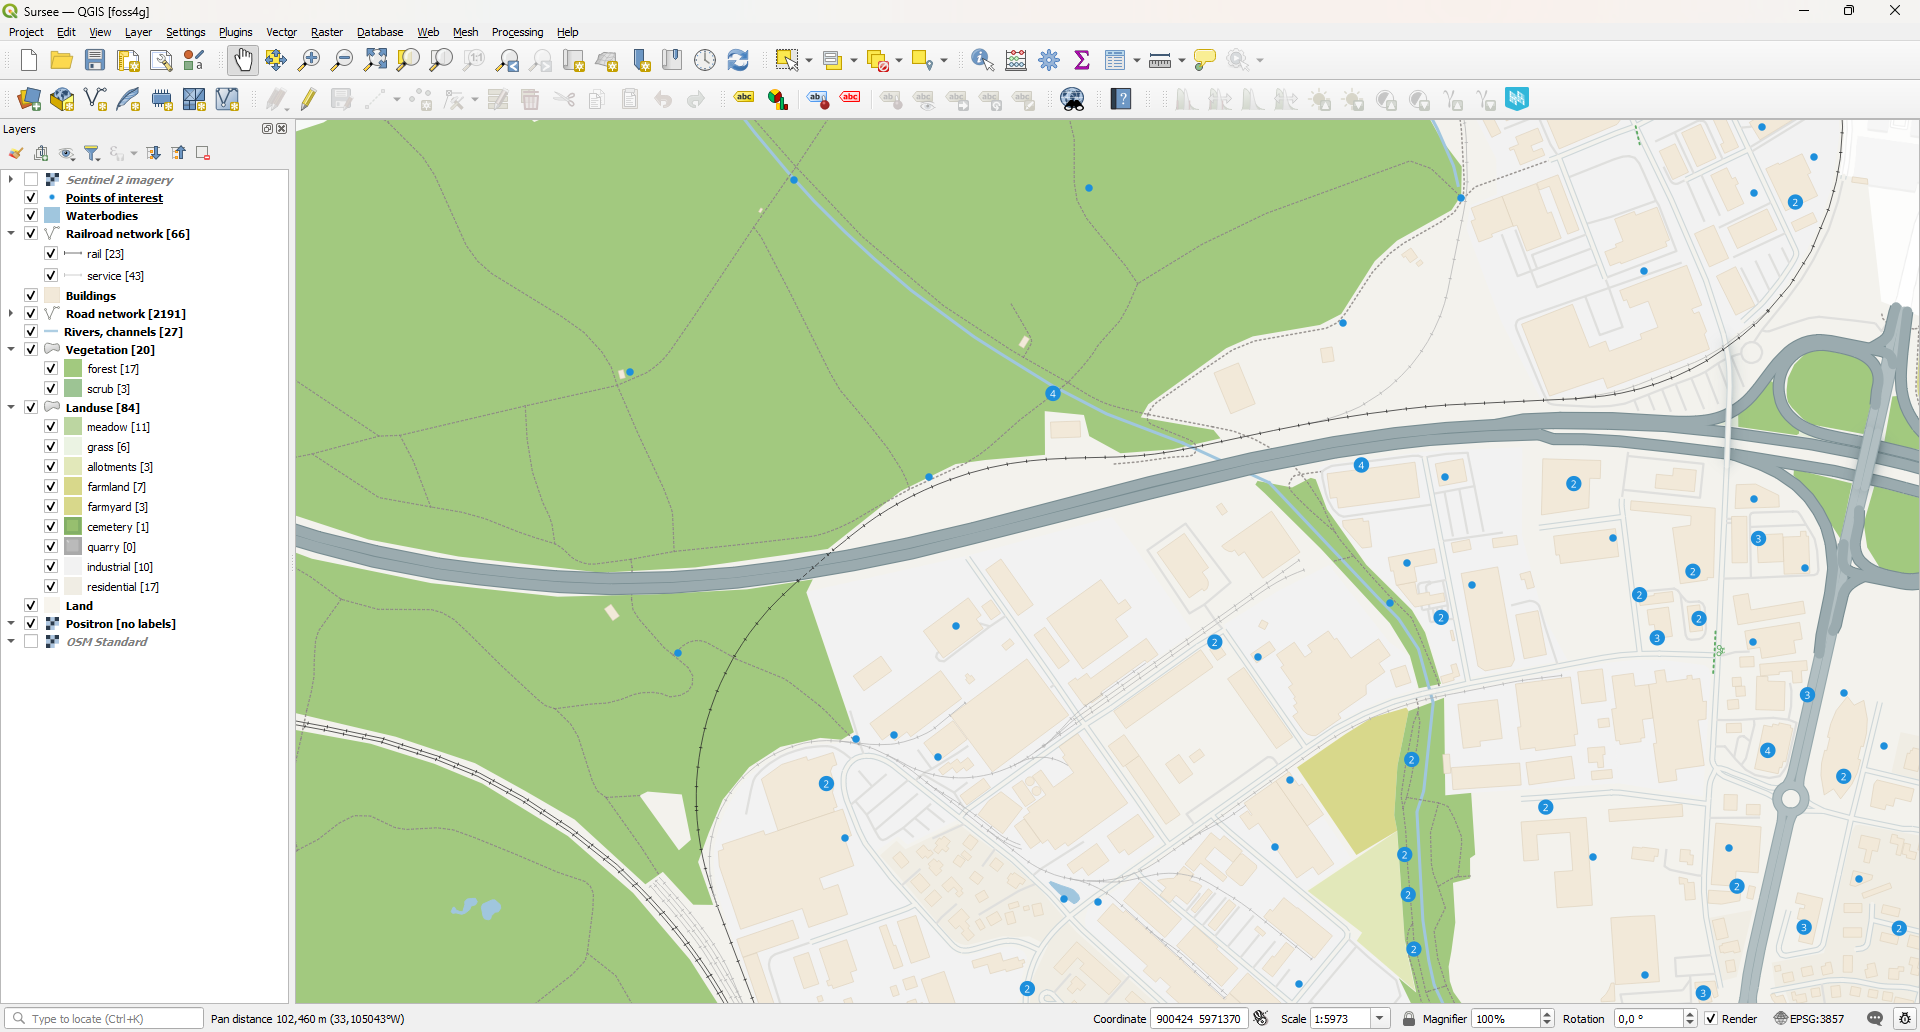
Zoom in to explore multiscale styling.
Step 3/5 Install NextGIS Connect plugin#
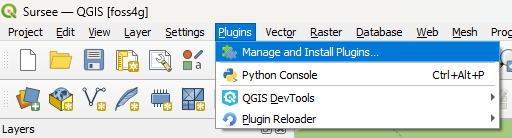
Go to the “Plugins” — “Manage and Install Plugins” menu
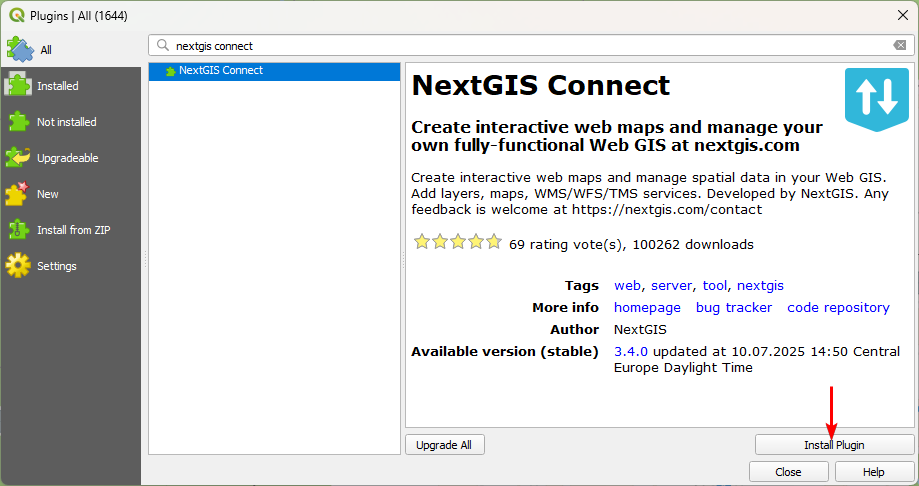
Go to the “All” tab and find a plugin named NextGIS Connect. Use a search bar at the top of the interface for faster access. Click the Install Plugin button.
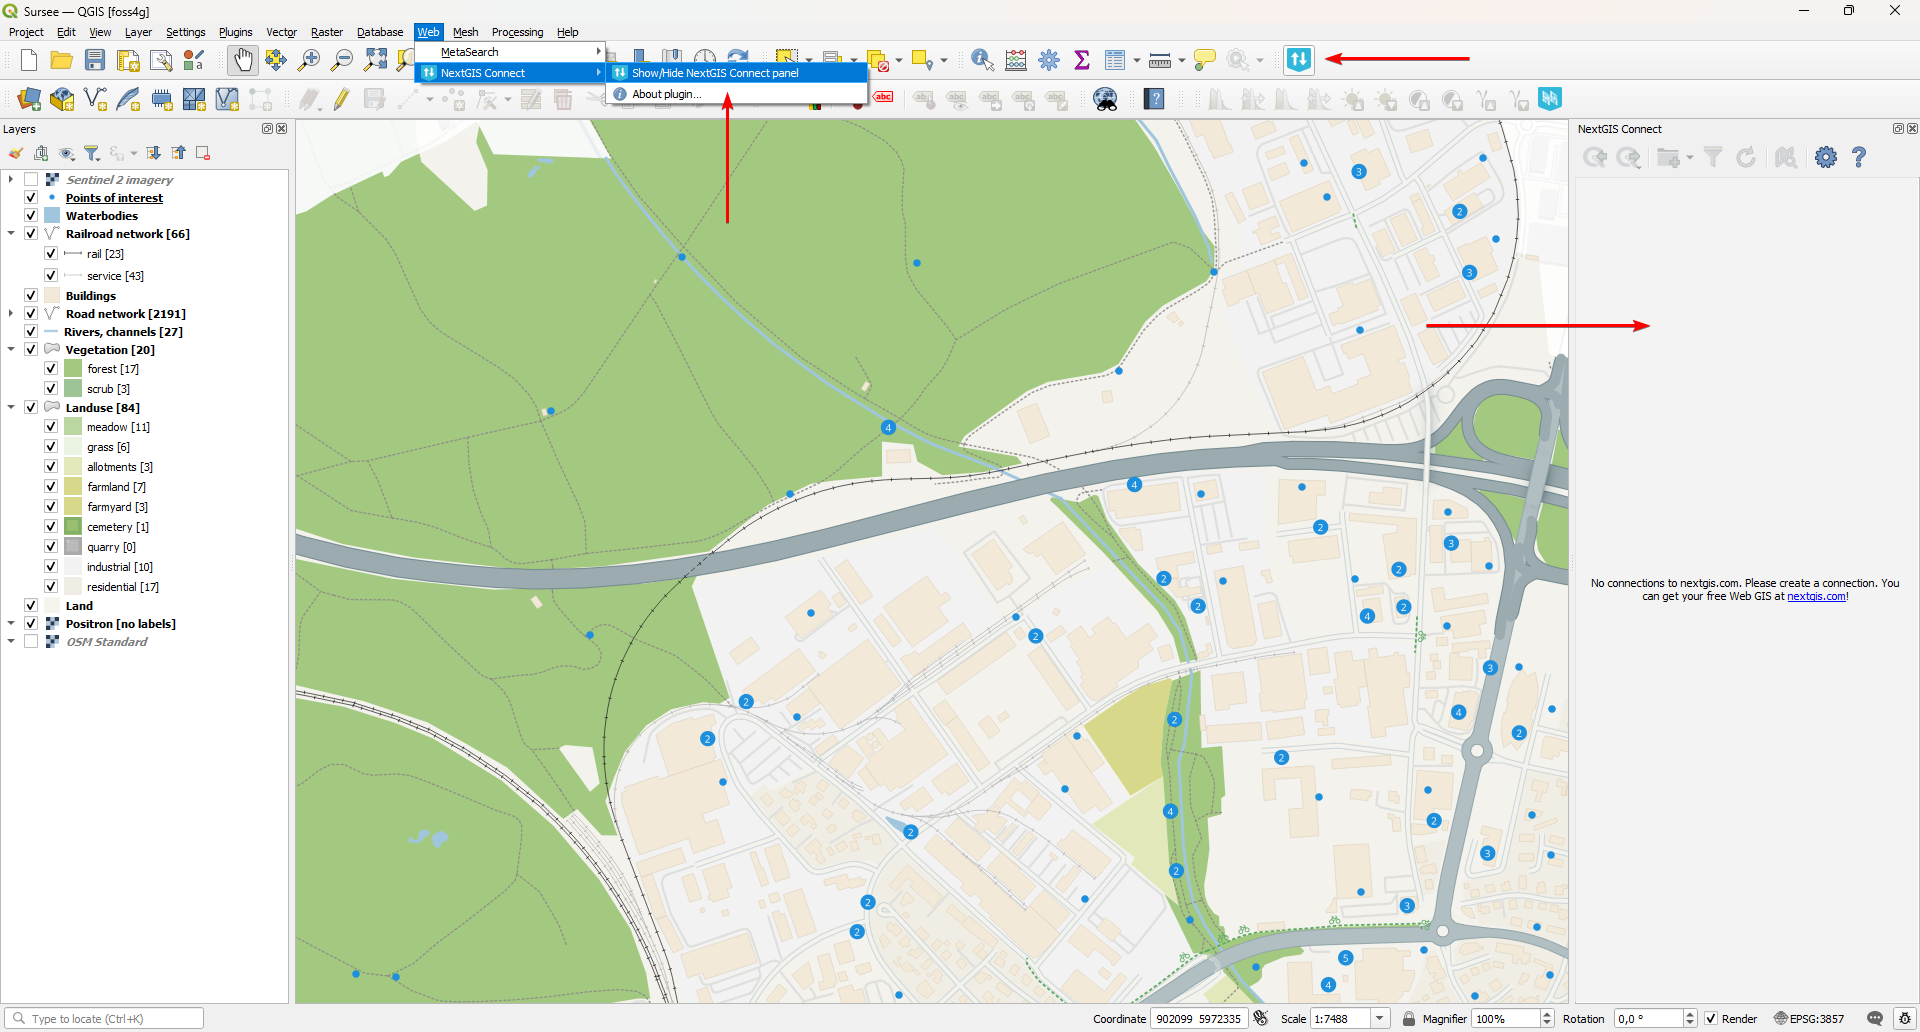
After installation NextGIS Connect is available in the “Internet” menu and as a toolbar icon: ![]() . When NextGIS Connect is active, the side panel is visible.
. When NextGIS Connect is active, the side panel is visible.
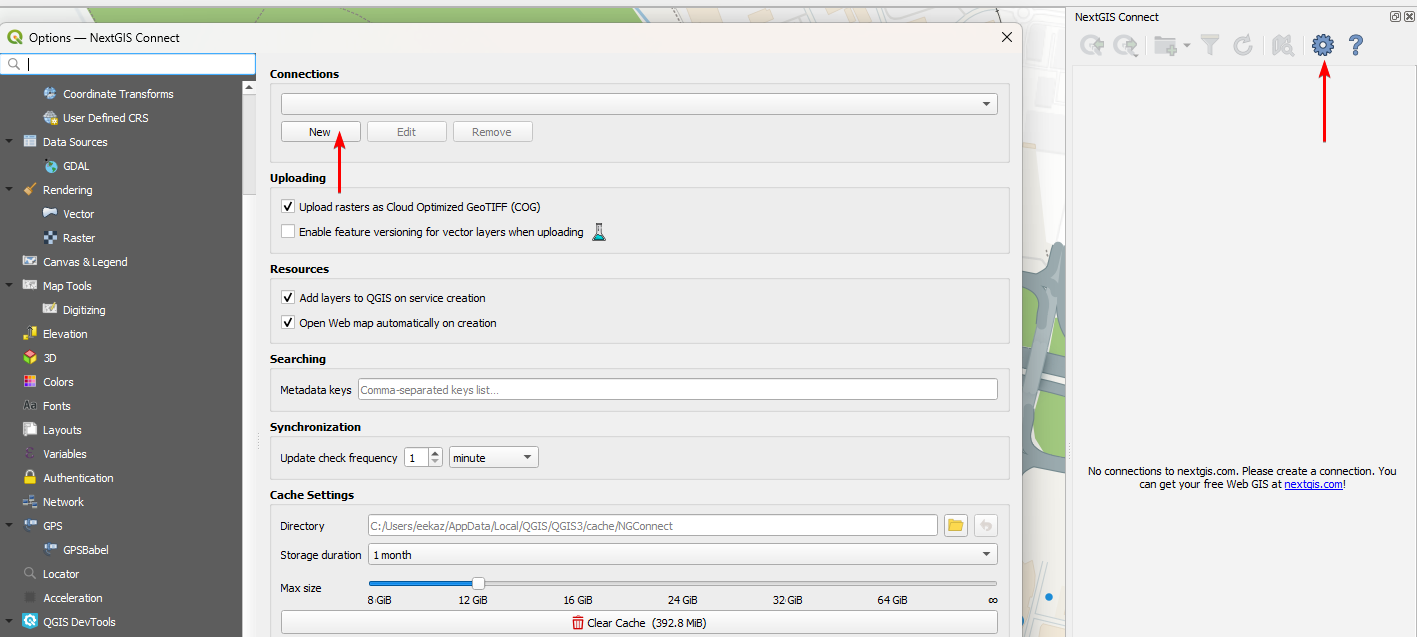
Go to the plugin settings, using  icon. This is a place for setting up everything related to QGIS–NextGIS Web integration. First, let’s create a connection.
Step 4/5 Create a connection#
To establish a link between your QGIS app and a Web GIS, you need to create a connection.
Go to the Web GIS page of your NextGIS ID account and copy the link to your Web GIS (see tutorial_my_wg_pic). In this example the link is: https://ngw-quickstart.nextgis.com.
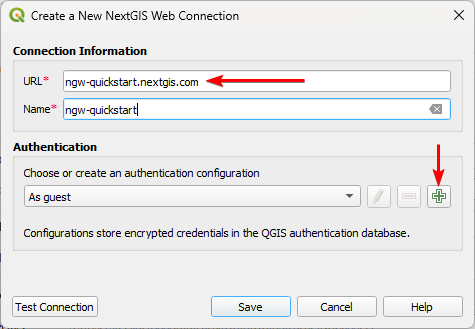
In QGIS open the NG Connect settings and click on the New button in the “Connections” group.
Enter the Web GIS address to the URL field, then click  to create a new Authentication configuration.
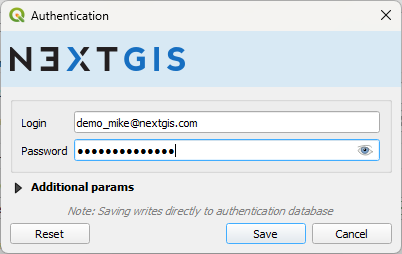
In the new dialog enter the email and password you used to register at my.nextgis.com at step 1, and click the Save button.
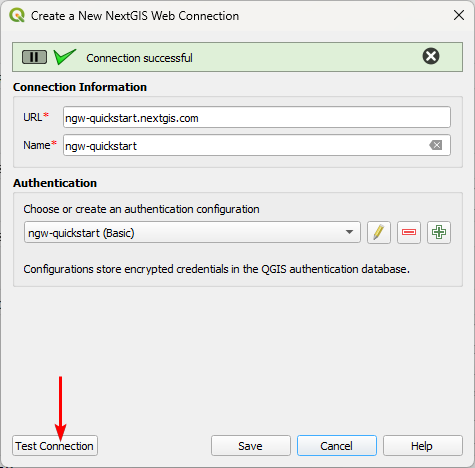
Click the Test connection button to ensure that you entered all the data correctly. Then click the Save button.
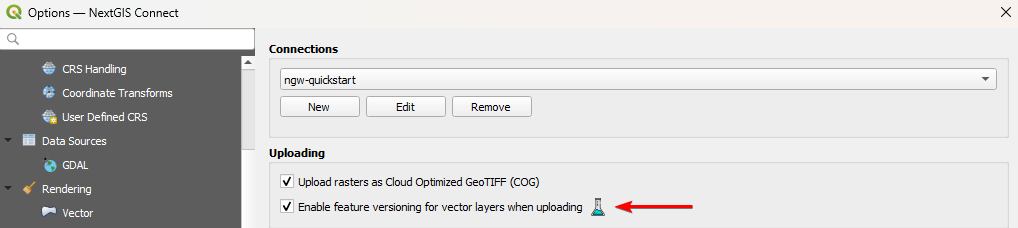
Tip
If you are going to edit data collaboratively, you can activate the checkbox “Enable feature versioning for vector layers when uploading”.
Exit settings by clicking the OK button in the bottom of the page.
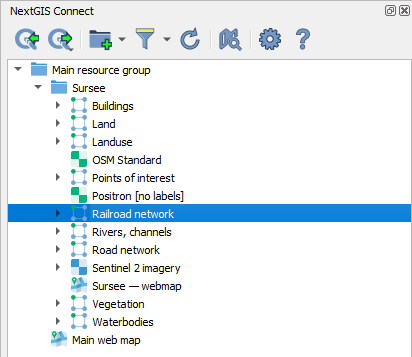
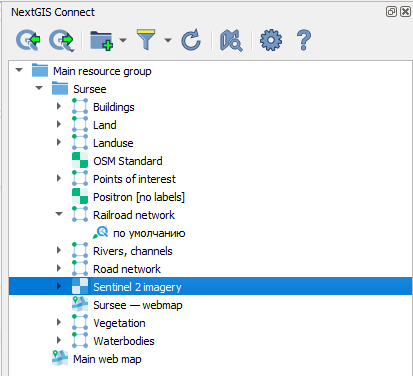
Now in the NextGIS Connect panel you can see the resource tree of your Web GIS.
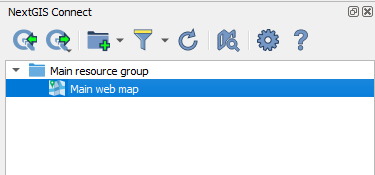
Using this panel you could upload local data to Web GIS, connect remote layers and maps to QGIS, update styles, create services and many more. It also provides a simple way to upload an entire QGIS project as a Web Map.
Step 5/5 Publish QGIS project to NextGIS Web#
In NextGIS Connect panel select the Main resource group folder, then open dropdown menu with  icon and select Upload all.
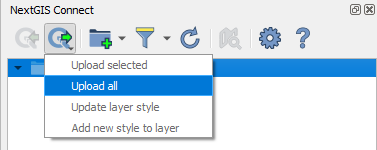
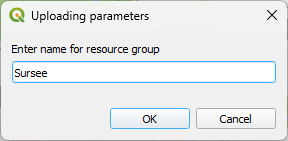
Enter a name for the project. In this example, it is Sursee.A folder with this name is created in Web GIS, and all the project data is uploaded there.
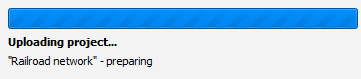
The upload starts. You can track the progress by checking the status message.
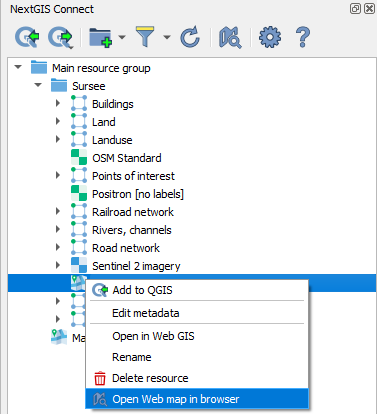
By default, once the Web Map is successfully published, it opens automatically in your browser. Also, you can open it from the Connect panel. Right-click on the Web Map and select “Open in browser” in the context menu.
Note that all the layers of the project are now visible in the NextGIS Connect panel.
Now you can explore the Web Map. Proceed to step 6 to learn how to connect to an existing Web Map in QGIS.
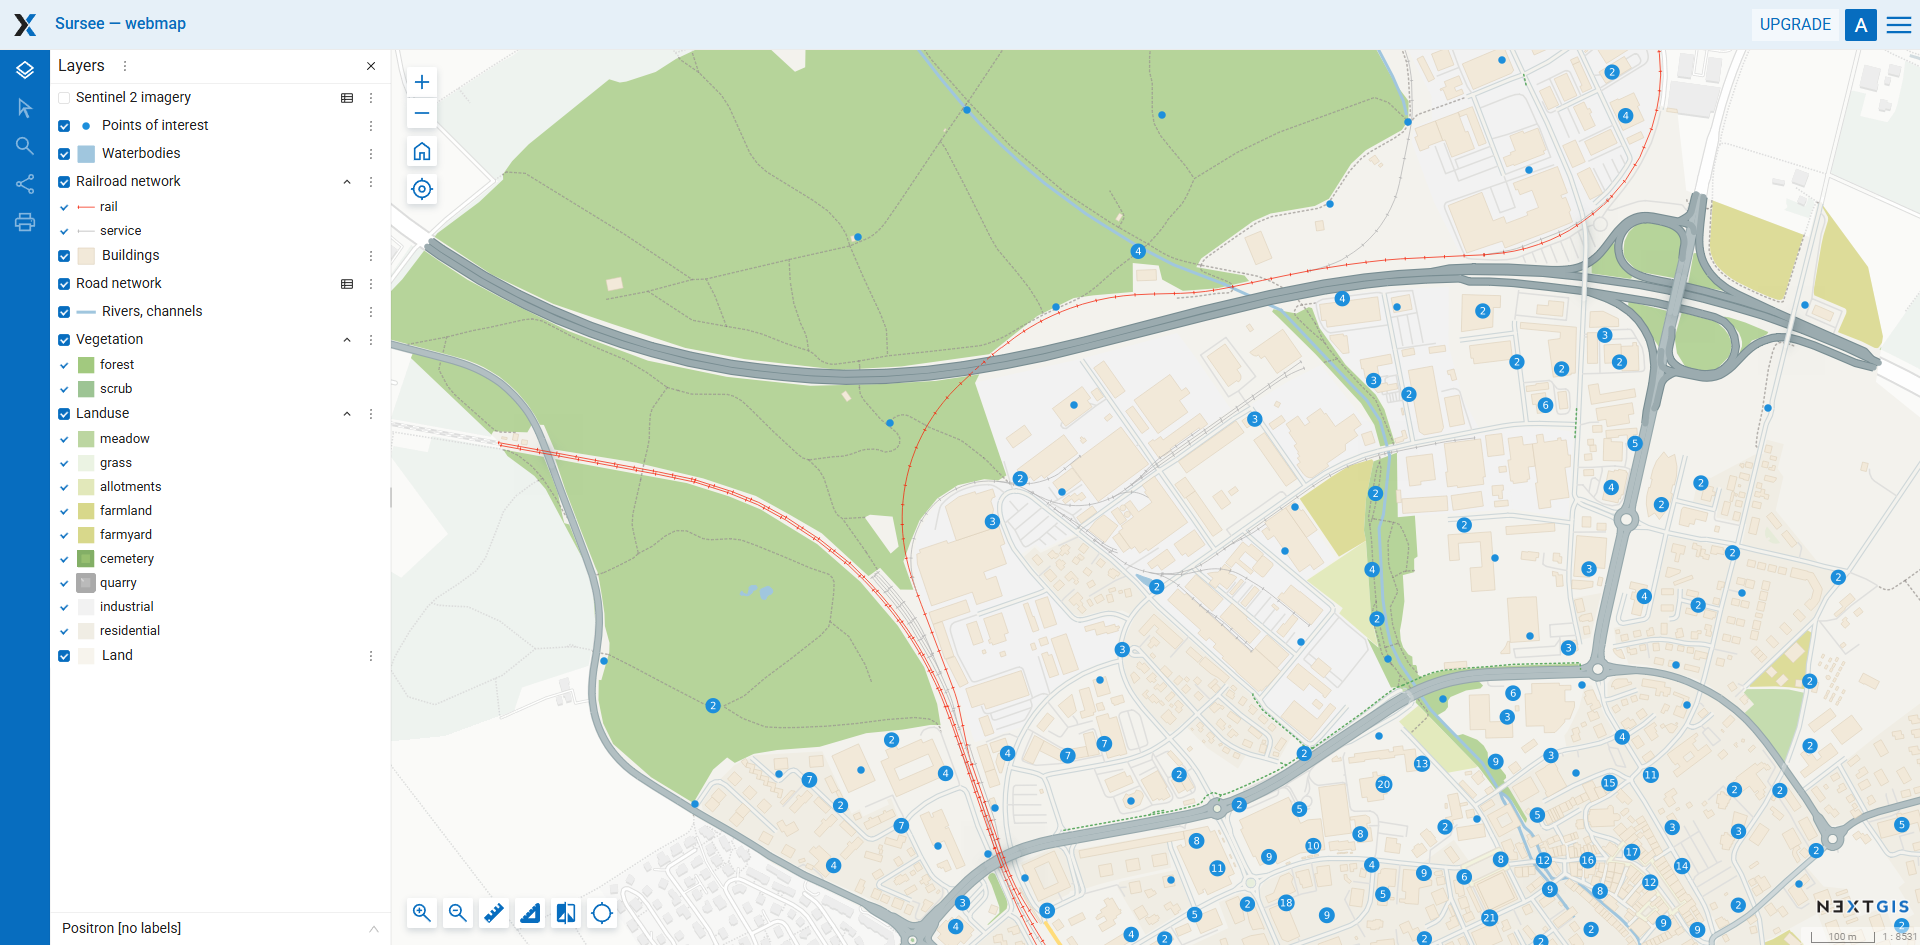
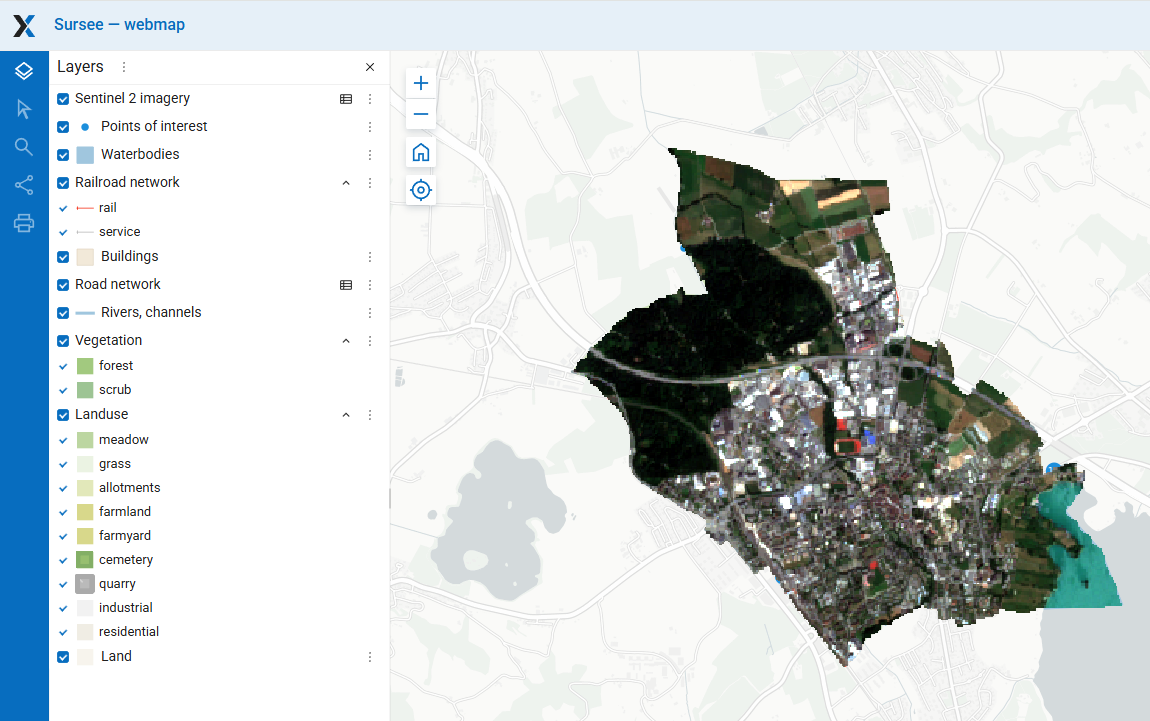
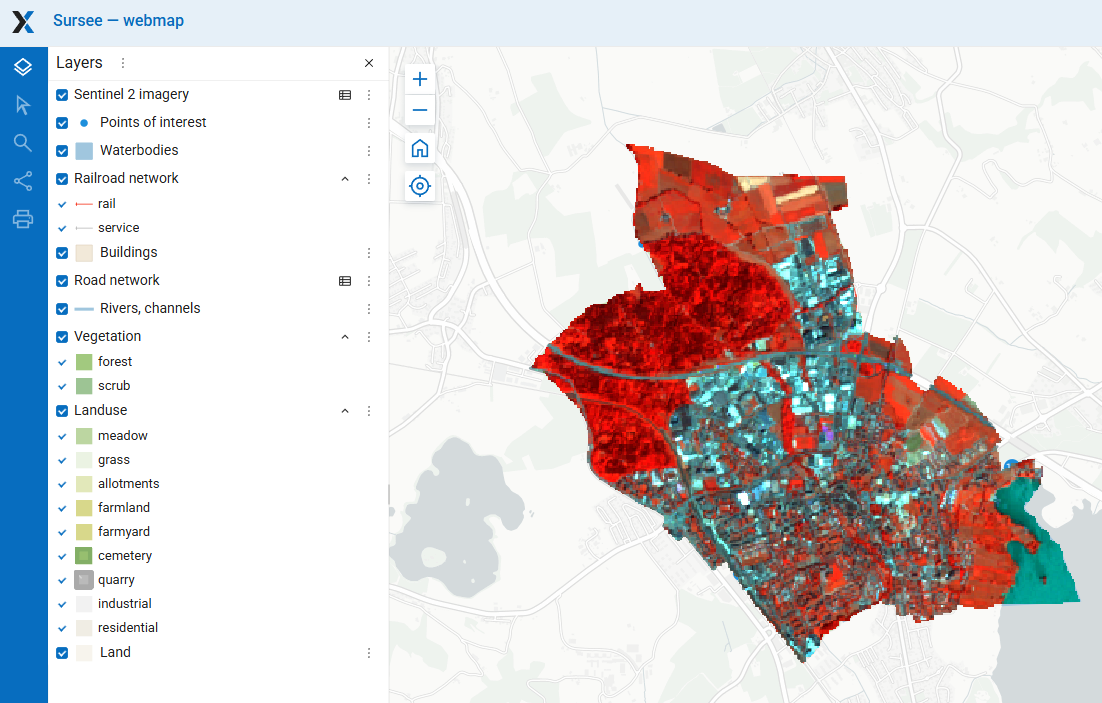
Explore the Web Map and resources#
A Web Map has been created from the project. It looks exactly the same as the original QGIS project, because NextGIS Web uses QGIS styles as primary way to define layer styles.
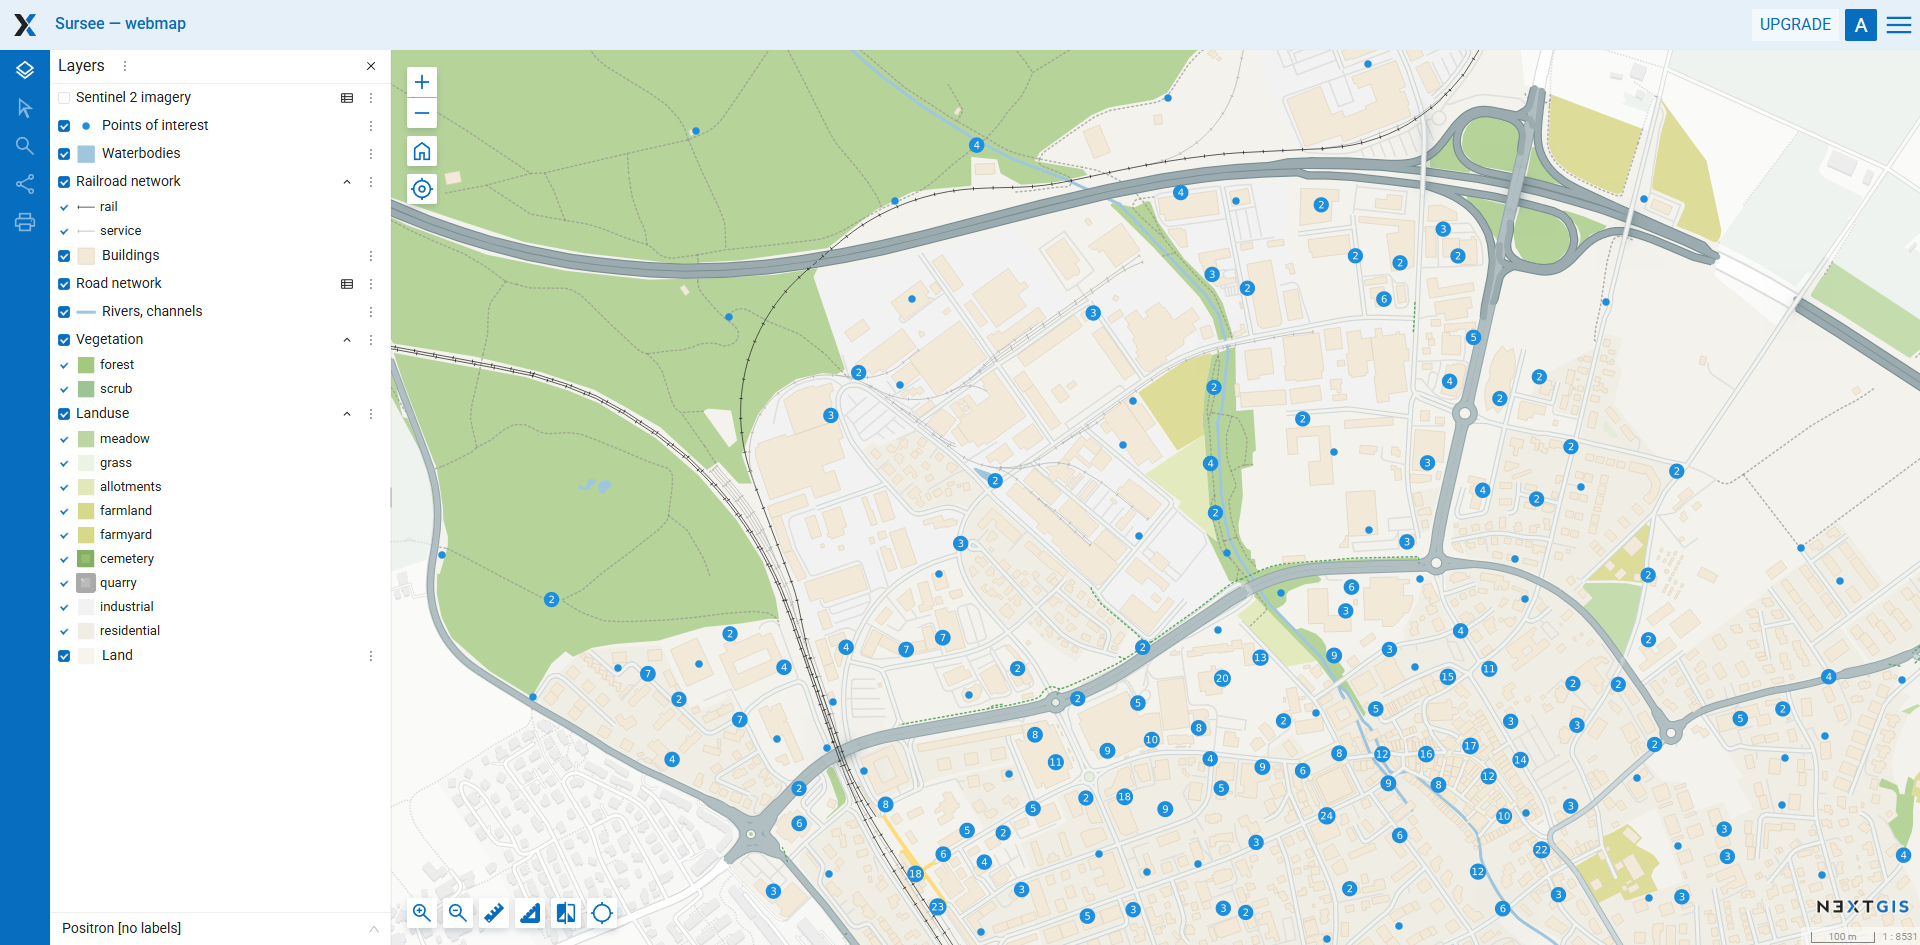
You can enable and disable layers and categories within layers. Web Map has its own URL, so you can easily share it. Play with the Web Map interface. Learn more about it: https://docs.nextgis.com/docs_ngweb/source/webmaps_client.html
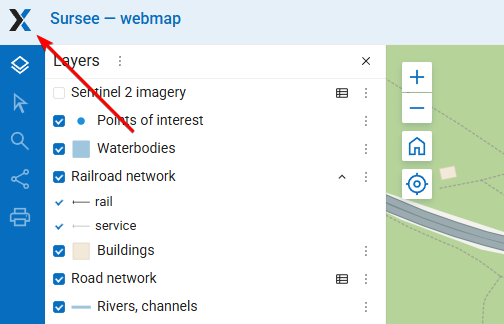
Click the  icon at the top left corner to view the main interface with the resource list.
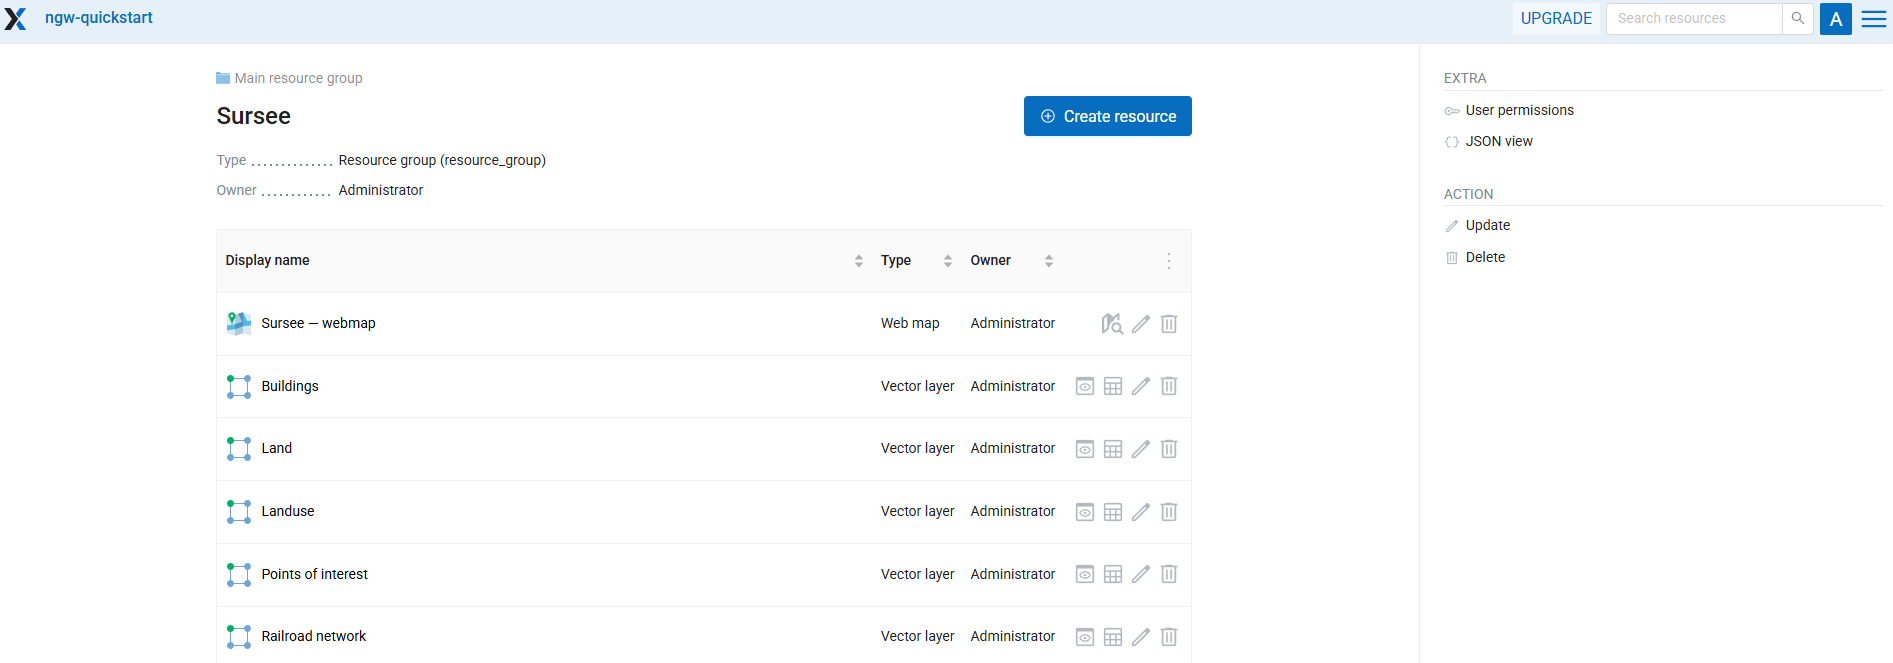
Open the Sursee folder. For each layer of the original project a corresponding resource was created in it.
You can work with the uploaded vector and raster layers independently from the Web Map — modify the data, publish it using different protocols etc.
What if you’d like to edit the uploaded layers in QGIS? Let’s see how to do it.
Connect to Web Map from QGIS#
In QGIS close the project (Project - Close). Imagine that you work from another computer, another QGIS instance. Keep NextGIS Connect panel open (reopen it if it’s closed).
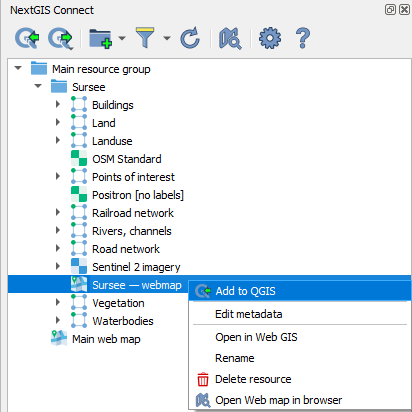
In the NextGIS Connect panel, find the Web Map resource Sursee - webmap, right-click on it to open the context menu, and select  Add to QGIS.
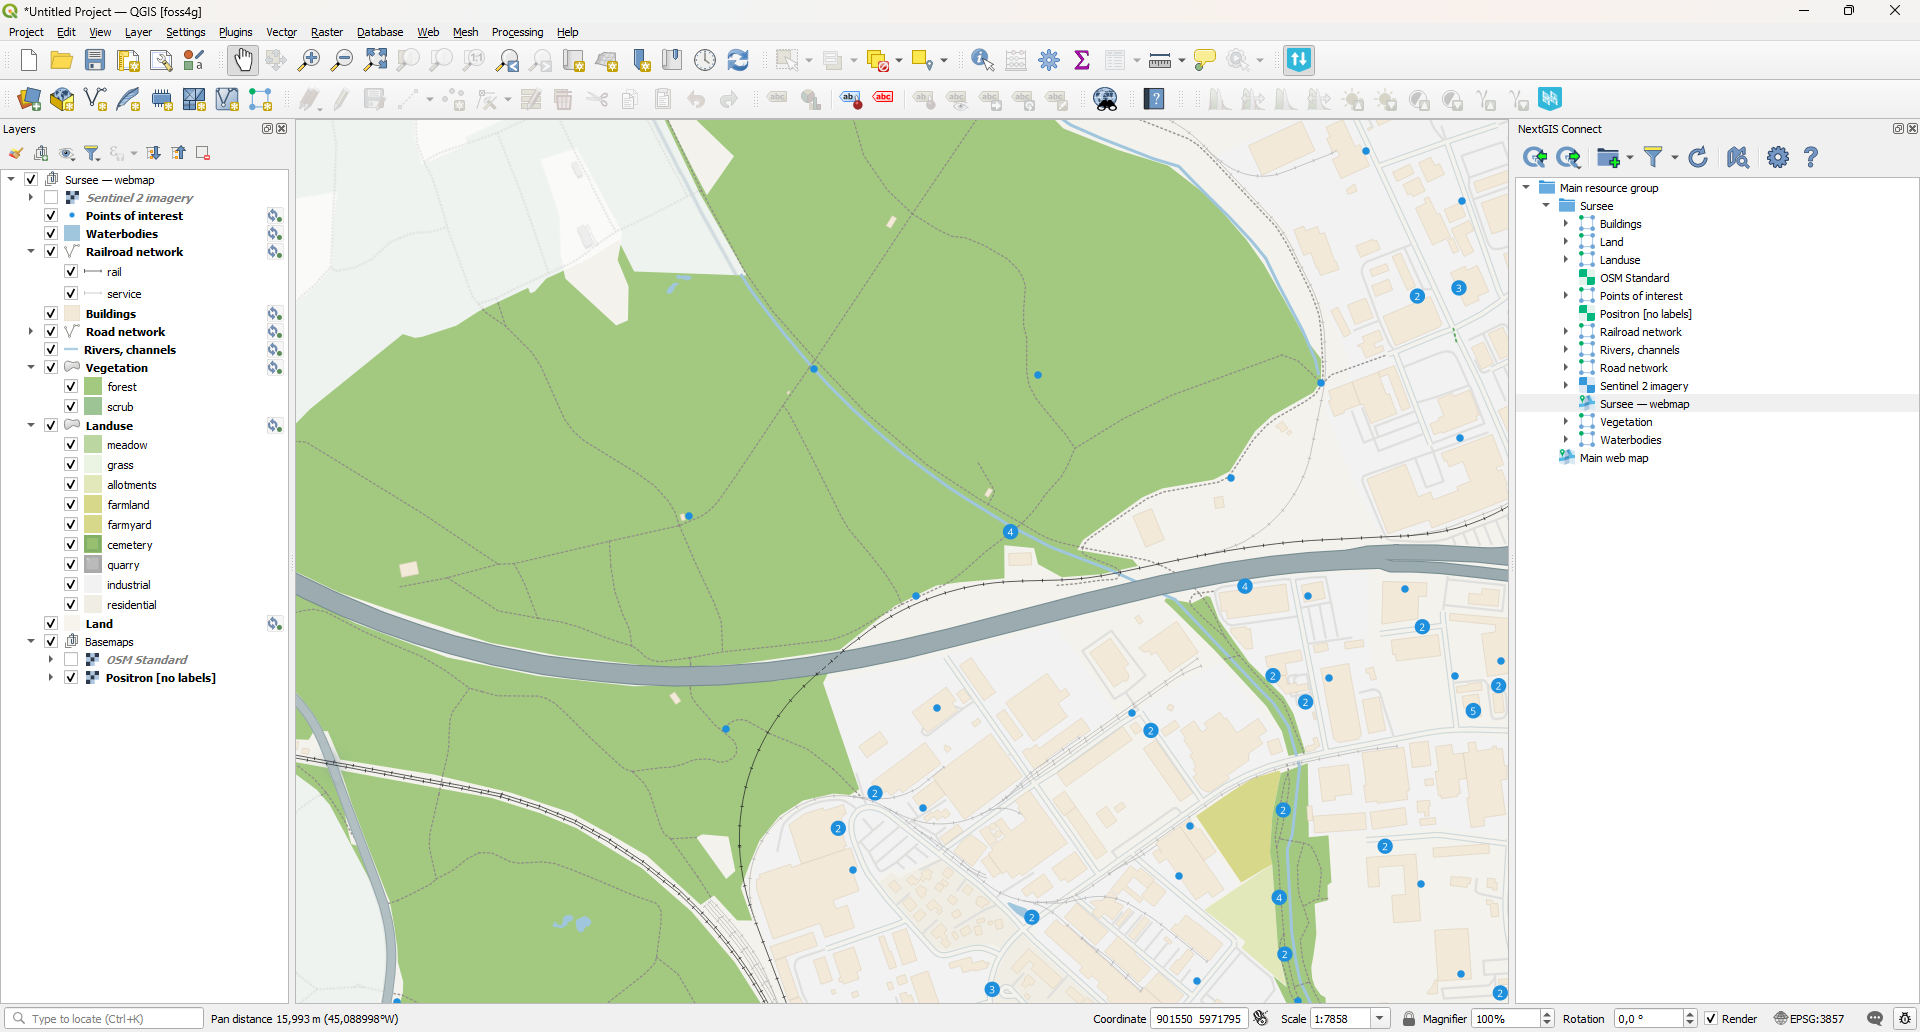
QGIS rebuilds the Web Map content locally, downloading all relevant layers and styles and arranging them to match the original structure.
What you get is basically the initial project fully reconstructed from the NextGIS Web.
Note that in the Layers panel vector layers have special marks to the right of their names:  .
.
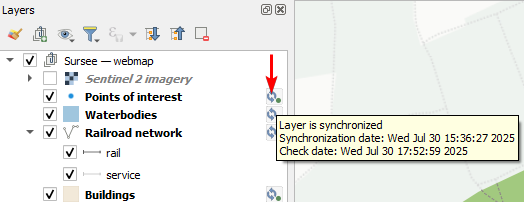
They are now linked to the server storage. If the data is updated on the server side, Connect synchronizes the local layer in QGIS. If the synched layer is updated in QGIS, Connect communicates it to the server and updates the data on the server.
One of the great uses of it is updating styles on the Web Map.
Modify layer styles on the Web Map from QGIS#
Let’s make railroads more bright and visible on our Web Map.
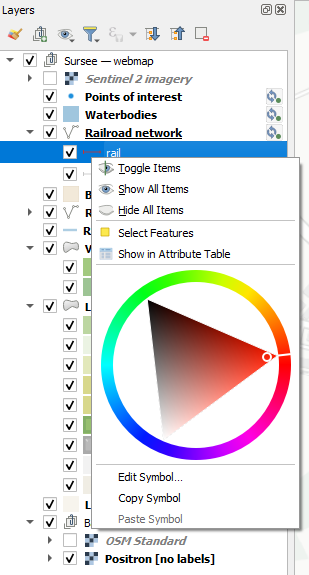
In QGIS, find the Railroad network layer in the Layers panel. Open the context menu of the “rail” symbol category. On the palette click on the color ring to select the red color. Click on the empty part of the panel to close the dialog.
Then find and select the Railroad network layer in the NextGIS Connect panel.
Go back to the Layers panel, open the context menu of the “Railroad network” layer and click NextGIS Connect –> Update layer style.
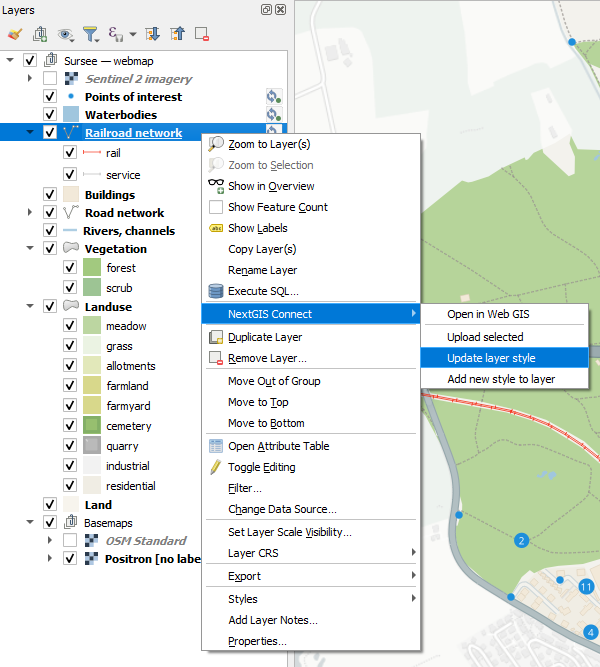
Go back to the web browser with the Web Map opened (reopen it from NextGIS Connect panel if it is closed). You’ll find that railroads have changed their color to red.
You can modify raster styles as well.
Update raster layer style on a Web Map#
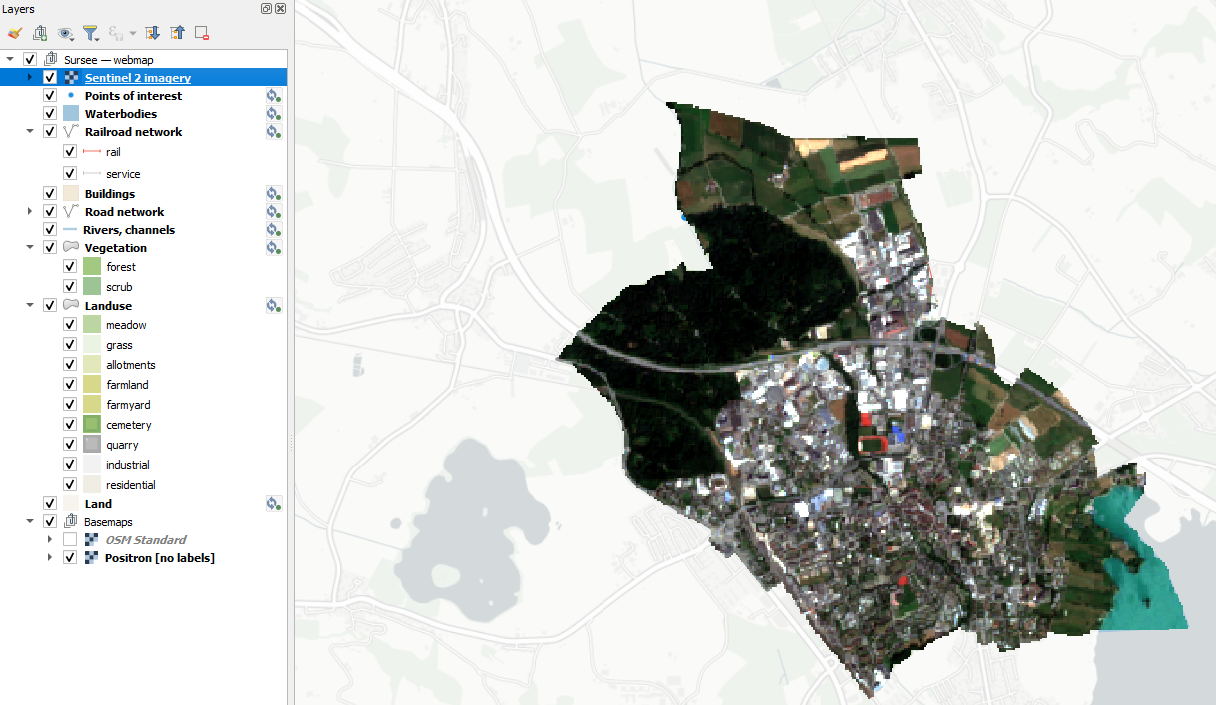
In QGIS, activate Sentinel 2 imagery layer. It is a 4 band satellite dataset, currently configured to display in natural colors.
Open its context menu and go to the “Properties”.
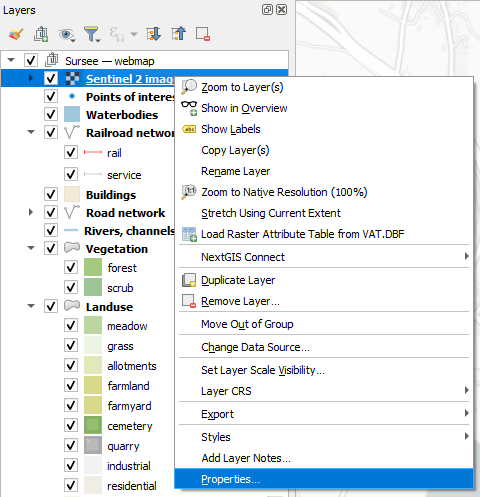
In the Properties, go to the Symbology tab, and change Band 3 to Band 4 in the Red band selector. The click OK.
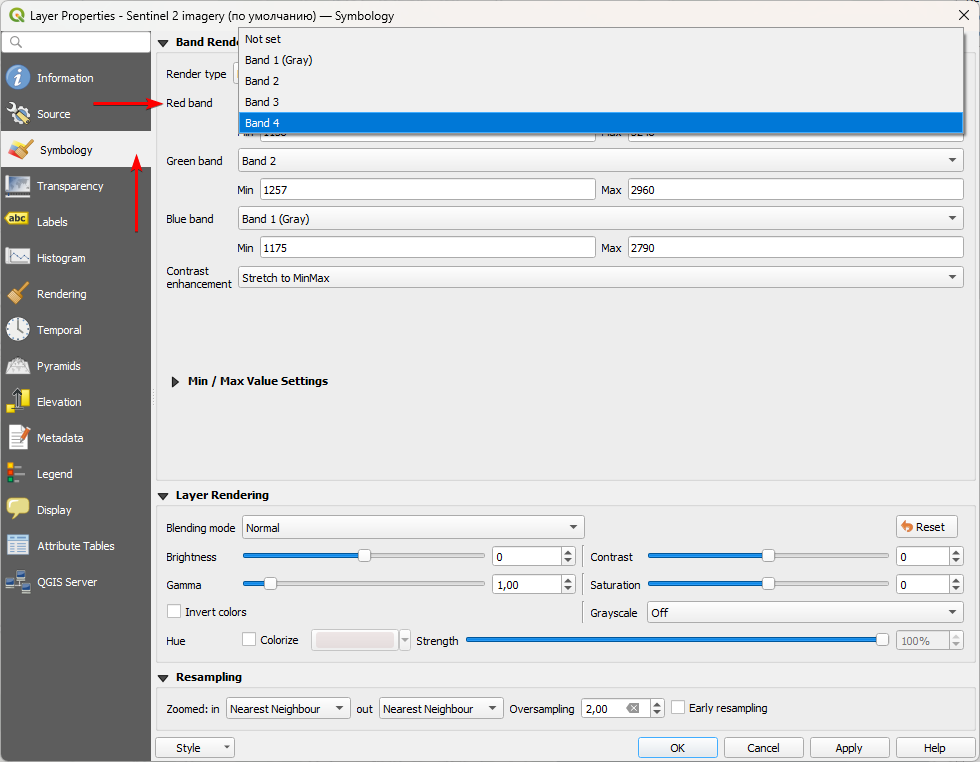
We’ve just replaced the Red reflectance data to the Near-InfraRed reflectance data, so the raster visualization has changed significantly.
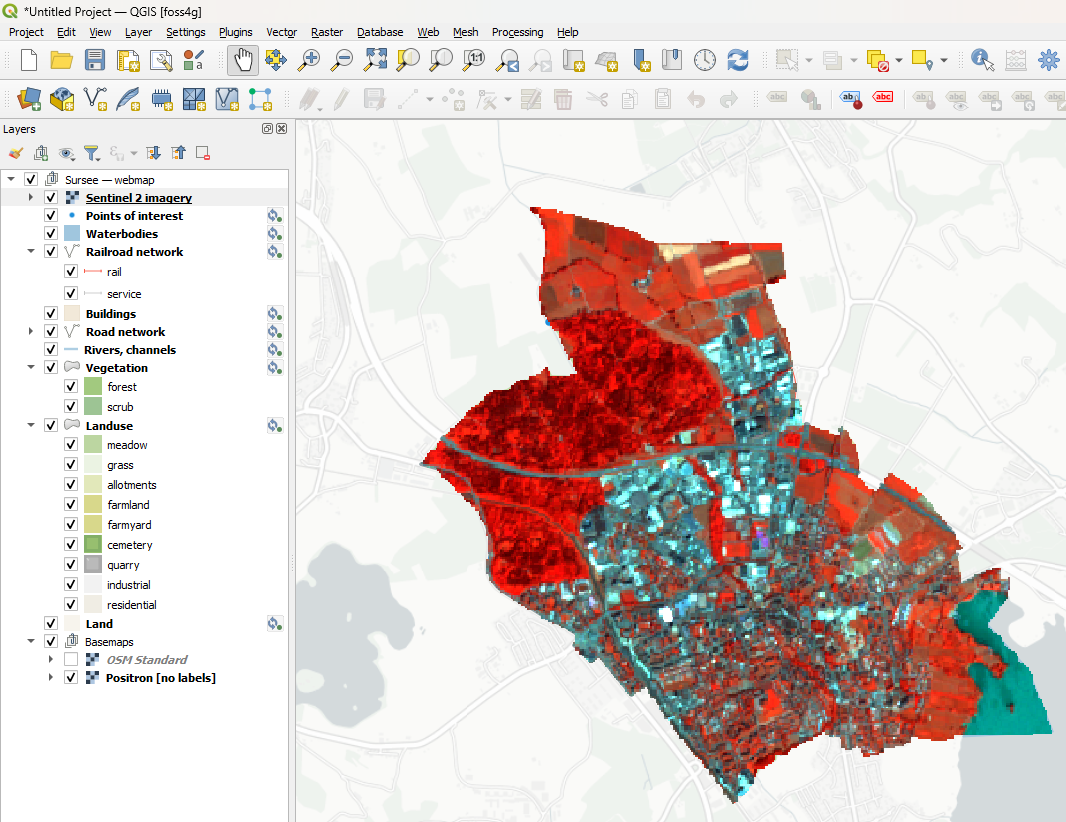
Open the Web Map and activate the “Sentinel 2 imagery” layer there. It still has its original appearance.
Return to QGIS, select the Sentinel 2 imagery layer in the NextGIS Connect panel.
Then open the context menu of the layer and click NextGIS Connect –> Update layer style.
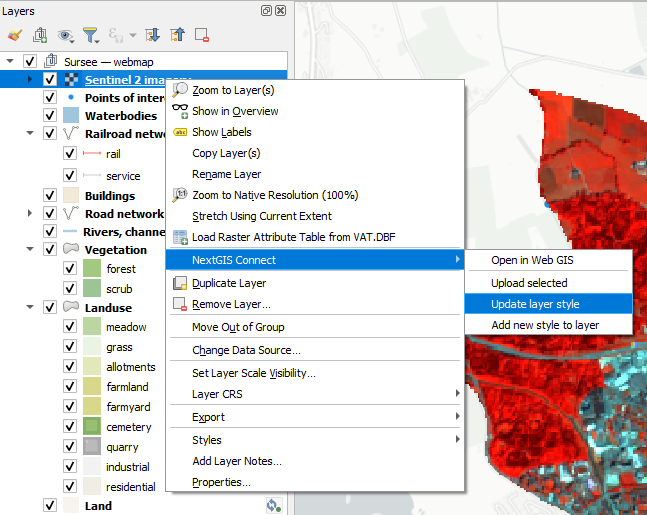
Open the Web Map again — layer style has changed.
NextGIS Web can handle multiband rasters with QGIS styles of any complexity.
Edit data from QGIS and explore results on the Web Map#
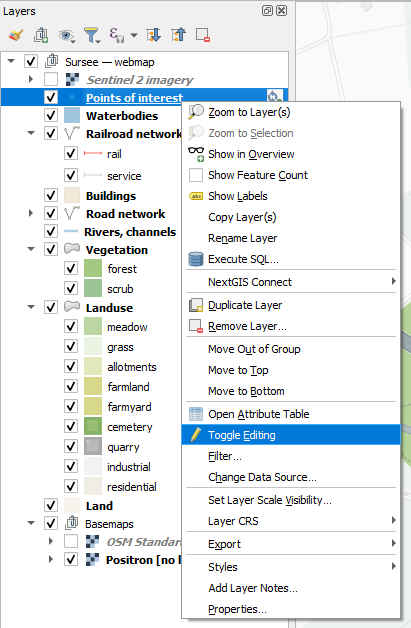
Return to QGIS, in the Layers panel select Points of interest layer, open its context menu and enable  Editing mode. Since this layer was added from NextGIS Connect, it is linked with Web GIS, so the edits are synchronized with the server.
Enable Digitizing toolbar and activate the  Add point feature tool.
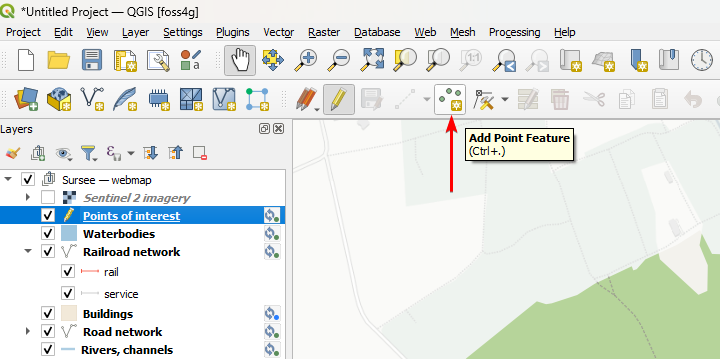
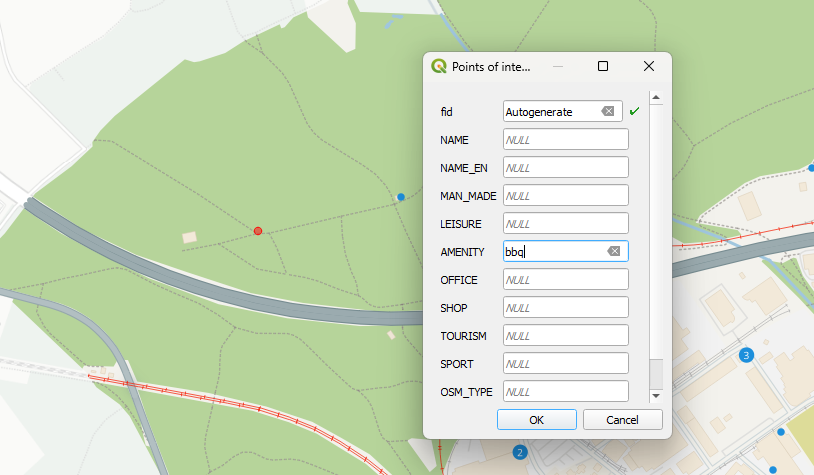
Let’s place another bbq spot in the forest. Left-click on a suitable place on the map, then enter one attribute value, AMENITY = bbq. Then click OK.
Click on to exit the Editing mode and select Save in the dialog to save the changes.
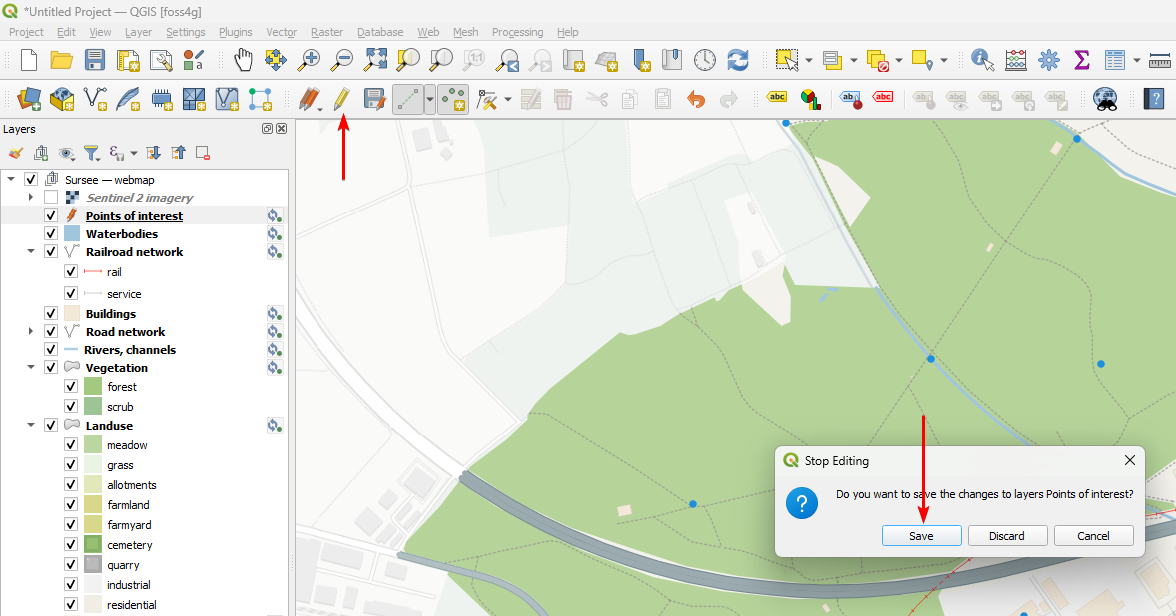
After you exit the Editing mode synchronization starts automatically. The new feature is sent to the server. Return to the Web Map to view it.
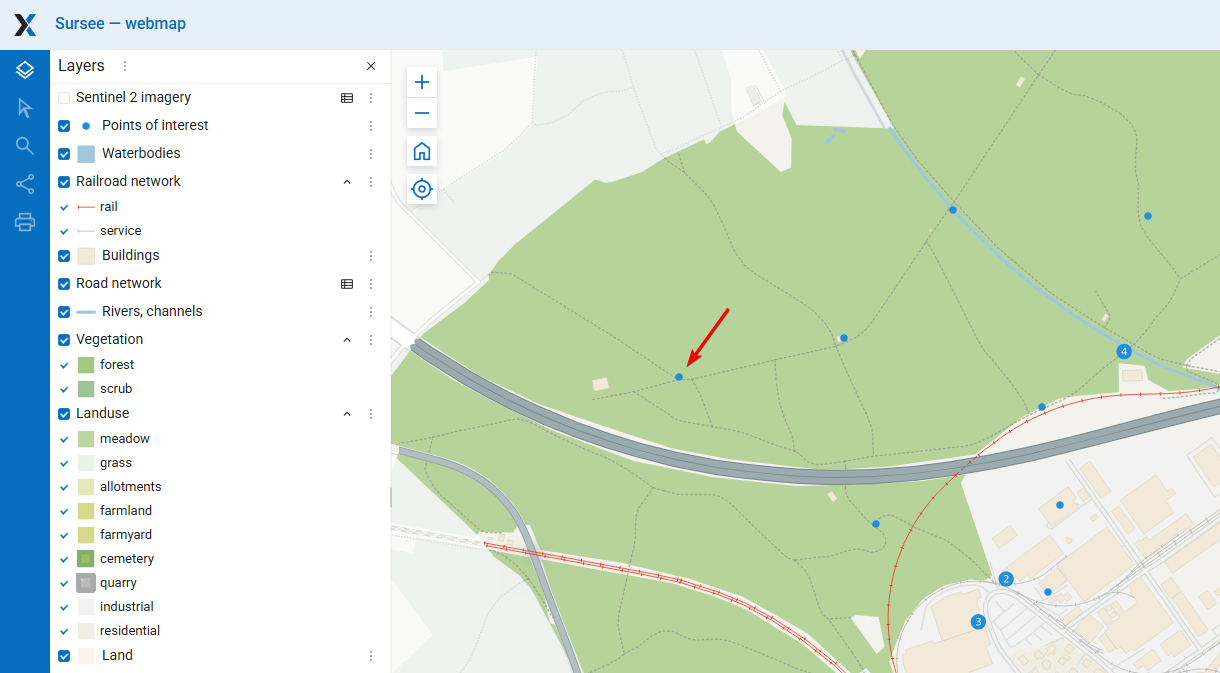
Users can connect to the same server data from multiple QGIS instances and edit the data simultaneously. Our stack provides a seamless, ready-to-go solution to enable team digitizing and data editing in QGIS.